Trading Articles
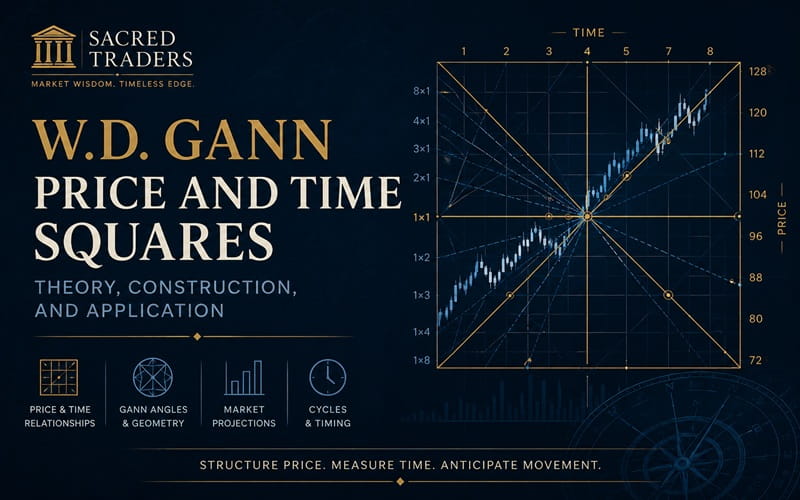
W.D. Gann Price and Time Squares: Theory, Construction, and Application
Much has been written about many of the fabled trading techniques of W.D. Gann. This article is not meant to be another one of the glorified recitations of folklore, but rather a healthy dose of trading practicality which I feel was the hallmark of Mr. Gann’s success. If we get our work done with this article, you will be able to incorporate many of the techniques we’ll cover into your present trading strategy. This article will confine itself to Gann’s use of squares (geometric figures) not only interpret past market history but also to provide practical insight into the future direction of the markets he traded.
SQUARES
Gann referred to the various price and time cycles as squares. So. for the novice investor reading this article, it may useful to simply substitute the word “square” with the word ‘cycle. This will help facilitate your understanding of these much maligned concepts. Squares or cycles are sometimes very difficult to visualize. So, Gann with his unique sense for practicality devised a method of actually displaying the many price and time cycles on a chart by the use of geometric angles which represented the duality of time and price. This in itself is an interesting yet blinding glimpse at the obvious – in terms of the market, price never occurs outside of the context of time.
To construct a square would call for an elaborate artistic effort which may result in a rather intricate network of vertical, horizontal and diagonal lines of varying degree which we call Gann Architecture. The charts are so intricate and provide so many lines that it will, for the most part. be useful to the average trader and of minimal use for the the advanced Gann technician. Nevertheless, to get a thorough understanding of Gann’s work, it is necessary for the beginning student to construct a few of these charts by hand. If you aren’t artistically inclined, we recommend using Peter Pich’s Gann Trader Ito construct these elaborate charts.
To construct one by hand, choose a market and starting with its all time high or low and draw the basis square. You know, a box with four equal sides. The size of the box should be in harmony with the kind of chart you’re working with. For example, using a weekly chart of the S&P 500 Index, I would recommend using the Square of 52 (for 52 weeks in a year). Once you have drawn your square you need to draw all the angles which Gann used from each of the corners on the left side of the square. Then divide the square into eighths or l6ths from top to bottom and left to right to create a time/price grid. Once complete, you will have fully constructed the time/price square in its basic from.
The angles that Gann used were very simple. He simply divided the range or high by two (50 percent retracement zone) and this angle would serve as his most important support and resistance. to construct this angle simply draw a 45 degree (or lx 1) uptrend line from the bottom and top left corners of the square. To construct the second most important support/resistance points, draw a 37 1/2 and 62 1/2 percent (2×1 and 1×2) uptrend and downtrend lines from the two left corners. This would complete a basic square as the next set of line are of lesser importance but nevertheless should be monitored. They are the 25 and 75 percent lines (4×1 and 1×4) and should be drawn from the left corners as well. And finally, one should consider the weak lines which Gann considered. They are at the 12 1/2 and 87 1/2 percent division (8×1 and 1×8). Horizontal and vertical range divisions should be executed accordingly.
SQUARES OF THE HIGH AND LOW
I consider the use of squares off major highs and lows to be of greater use to the trader than the generic overlay technique described above. The technique is very similar and should provide the trader with a vast array of time/price projections which can be very useful to the active trader. Take for instance the square of the high for example. Using the S&P 500 Index, the recent all-time high for the move is around 348. Using this technique on the daily chart, you should draw a box that the top left corner starts at the 348 high and moves forward (horizontally to the left) in time by 348 days. As you can see, you going to need a sufficient amount of chart paper to complete this exercise. Then draw a vertical line down to zero. since all for sides of the square are equal, you can easily complete the box. Now, as in the previous exercise, divide the box vertically and horizontally into eights or sixteenths. Once this is done, all you have to do now is draw in the Gann angles from the left hand corners and presto, you now have a fully constructed square of the high.
Advanced Books and Courses on W.D. Gann Methods


To construct a square of the low, you basically follow the same steps as when constructing a square of the high. The only difference is, instead of drawing the vertical lines down to zero, extend them upward to the high prominent high (which will most likely be the all-time high). Armed with the support and resistance architecture offer by the powerful charts a trader may be informed of the majority of time/price projections for its future market action.
SQUARE OF THE RANGE
The square of the range was Gann’s most practical and effective technique. This single technique alone can account for as much as 60 percent of the total effectiveness in any trading trading system. A trader could use this technique in any time series ranging from short term intraday charts to the long term monthly and annual charts. I utilize this strategy to develop my day trading strategies we recommend on our hotline service -MARKETLINE!, The Professional’s Choice. This service has averaged 27 trades a week in ten markets with an average percentage of profitable trades at 59.25 percent. Average daily Gains amount to more than $1300 per day on a $50,000 margin account. The core strategy employed in our analysis in all time series is Gann’s squaring of the range.
To construct this square, simply use the same techniques we’ve described above but confine the square to the range of the recent advance or decline you interested in and presto, you have in your hands perhaps the most effective trading tool available to date. While there are numerous trading strategies which can be developed with this tool, the most important things to remember are: I) don’t expect to see a reaction at each one of the range divisions and angles within the square. This would only result in a huge waste of time and trading at everyone of these area could result in tremendous losses. 2) look for the valuable opportunities to show up around the 37 1/2. 50 and 67 1/2 percent range division in angles, time and price. Any convergence and intersections of these lines should be regarded as significant opportunities. And, 3) as with all trading tools, they are most successfully employed when using another set of tools to confirm or invalidate your trading hypothesis. We recommend Elliott Wave theory, Fibonacci ratios and a variety of momentum oscillators to “smooth” the raw data developed with this technique.
How to use price time square outside the range?