Trading Articles
Trading Volatility By Russell Rhoads
The Cboe Volatility Index has been used as a measure of fear in the market, but there’s more to it than that. Find out how you can use the Vix to take a position when you have an opinion about the direction of volatility in the equity market. Throughout the stock market goofiness in the second half of 2008, we were constantly told there was panic and the high level of the Cboe Volatility Index (Vix) was cited. If you were even just a passive viewer of CnbC or any business program, you got the impression that the Vix was a measure of fear and the higher the Vix went, the more frightened investors became. There is a lot more to Vix than using it to tell the public there is fear in the market. In fact, there are ways that traders can take a position when they have an opinion of the future direction of volatility in the equity market.
A Quick VIX History
The history of the Cboe volatility index stretches back to 1993, when Robert Whaley of Vanderbilt University published a paper on calculating volatility. His methodology in 1993 was to measure the stock market’s expectation of a 30-day volatility that was implied by at-the-money Standard & Poor’s 100 or oex option prices. In 2003, the Cboe along with Goldman Sachs updated the Vix to reflect a new way to measure expected volatility. This new method involved calculating market volatility through averaging the weighted prices of S&P 500 (Spx) puts and calls over a range of strike prices. The updated calculation also takes pricing from two expiration dates instead of just the closest expiration date.
With the popularity of the Vix as a market monitoring tool, the Cboe introduced a variety of volatility measures to the marketplace. The Cboe now calculates and publishes data on several other stock market indexes, including the Cboe naSdaq 100 volatility index (Vxn), Cboe djia volatility index (Vxd), and the Cboe Russell 2000 volatility index (RVx). Finally, in 2008 the exchange branched out into measuring volatility to include alternative investments through the Cboe crude oil volatility index (oVx), Cboe gold volatility index (GVz), and the Cboe eurocurrency volatility index (eVz).
Trading The VIX
Most traders have heard of the Vix, especially about the incredible levels it reached at times in 2008. However, there are some who are not aware that there is a variety of ways to trade expectations of the Vix. The Cboe offers futures contracts and options on the Vix, while there are exchange traded notes (etns) that trade based on near-term and longer-term market expectations of volatility. Because of the increase in volatility that the financial markets have experienced in the past couple of years, these products continue to interest traders. The result has been liquid tradable markets in all available instruments related to movements in the Vix.
VIX Futures
In March 2004, the Cboe commenced trading volatility index futures in the Cboe Futures Exchange (Cfe) arena. On the first day of trading, 401 contracts changed hands on four expiration contracts. Now, the exchange offers seven consecutive monthly contracts and in June 2009 the average daily volume was more than 3,000 contracts, and on June 30, 2009, the open interest in Vix futures contracts was more than 27,000.
With the success of the Vix futures, the Cfe chose to launch mini-Vix futures on March 2, 2009. The contract specifications call for a contract size a tenth of the full-sized Vix contracts or $100 times the Vix. In addition, instead of seven months in the future, currently mini-Vix contracts trade only on the next three-month expiration dates. Contract specifications for the Vix and mini-Vix futures contracts aredisplayed in Figure 1.
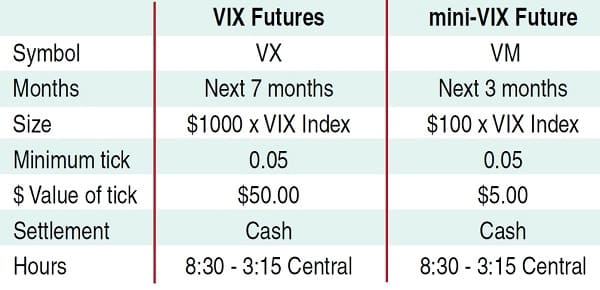
There are some unique characteristics regarding the Vix futures relative to what may be considered traditional futures contacts. Specifically, the Vix futures are purely bought or sold based on where a trader expects the spot Vix to settle at expiration. Unlike the S&P 500 futures, where a fair value may be determined relative to the index each day, the Vix futures are trading purely on anticipation.
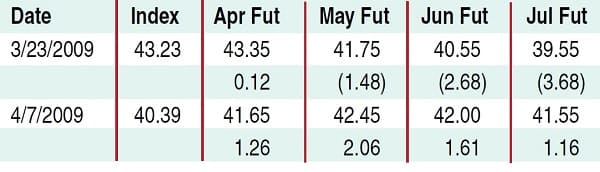
An example of this price behavior is displayed in Figure 2. This figure shows the settle price for the Vix along with the nearest four futures expiration prices. On the first date, March 23, 2009, with the exception of the front month, the Vix futures are trading at a discount to the spot Vix on the close. Just 11 trading days later, on April 7, 2009, all four futures contracts are trading at a premium to the Vix closing price. The only thing that has changed is the anticipation of the direction of volatility in the marketplace. As the Vix futures contract trades specifically in the direction that traders believe the spot Vix is going to go over a period of time, there are some analysts and traders who try to use the Vix futures to predict future moves in the equity markets.
Suggested Book: Trading VIX Derivatives
VIX Options
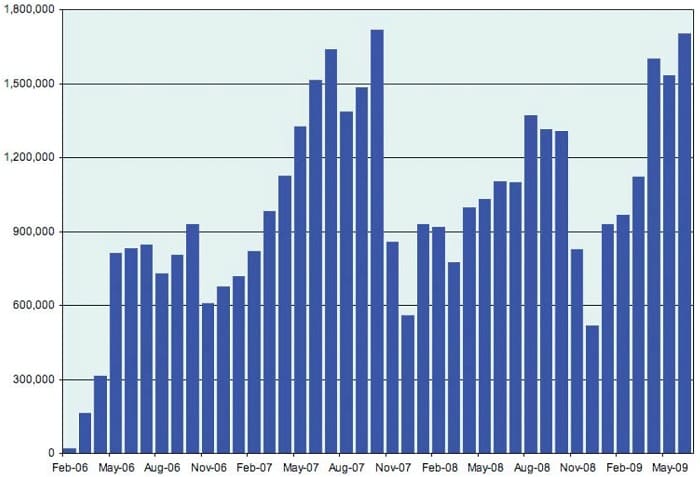
Options on the Cboe S&P 500 volatility index commenced trading in February 24, 2006, with a first-day volume of more than 10,000 contracts. The popularity of Vix options has been tremendous and as of the end of June 2009, the open interest in Vix options was close to a record high at just under 1.7 million contracts. Figure 3 shows the growth in open interest on a monthly basis since the introduction of Vix options.
Like the Vix future contracts, the Vix options are a unique trading vehicle. First, and it is something to always keep in mind: Vix options do not expire on the same day as traditional equity options. Traditional equity options will expire on the third Saturday following the third Friday of a month. As the Vix is a measure of 30-day volatility, the Vix options expire on the Wednesday that is 30 days prior to the next equity option expiration date. The options expire on Wednesday, but the last day of trading is the Tuesday beforehand.
In addition, a unique feature of these options is how a trader should determine the value of an option based on the underlying. Unlike many index options, Vix options traders should focus on the corresponding Vix futures when valuing an option, not the current level of the underlying Vix. This stems from the Vix options being European-style options that may only be exercised on expiration.
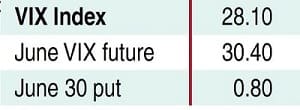
Figure 4 is an example of what appears to be the mispricing of a Vix put option. Note the June 30 put is trading at 0.80 a contract while the spot Vix is trading at 28.10. At first glance, this quote appears to be off as based on the strike price of 30 and the current index level of 28.10. At minimum, the June 30 put should be trading at 1.90 (30–28.10). However, June Vix options are priced based on the corresponding futures contract. Since the June Vix is trading at 30.40, this quote is much more reasonable.
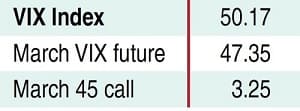
This sort of pricing can occur with call options as well. Figure 5 is an example of the Vix futures trading at a discount to the spot Vix and the calls appearing to be way too cheap. In this example, the Vix is at 50.17, while the March 45 call is trading at 3.25. This appears to be almost two points less than the intrinsic value of the option. Once again, the futures contract, in this case the March futures contract, should be used as the underlying. When using the March contract, the options appear to be reasonably valued.
Whether or not you choose to trade the VIX, it is worth putting on your screen and monitoring.
VIX Exchange Traded Notes
The final method that allows a trader to take advantage of moves in volatility was introduced by Barclay’s iPath division in early 2009. The iPath S&P 500 Vix Short Term Futures (Vxx) and iPath S&P 500 Vix Mid Term Futures (Vxz) exchange traded notes (etns) were introduced in early 2009 and have caught on. In May, the Vxx average trading volume was almost 400,000 shares, while the longer-term Vxz averaged just over 90,000 shares a day.
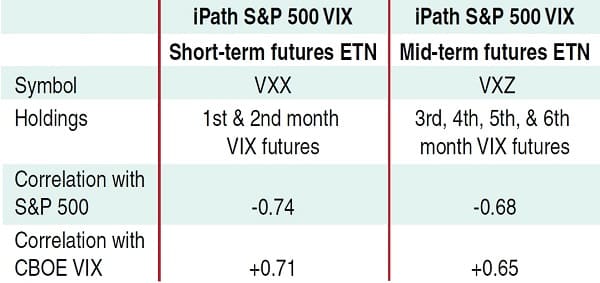
The Vxx etn represents an investment in the front two months’ Vix futures on a rolling basis while the Vxz focuses on the third-, fourth-, fifth-, and sixth-month futures contracts on the Vix. Each offers a simple way to gain long-term exposure to the Vix without having to roll positions or worry about expiration. More information on these two etns is displayed in Figure 6.
Conclusion
Whether or not you choose to trade the Vix, at minimum as a derivative market (and derivative of a derivative market) of the S&P 500, it is worth putting on your screen and monitoring along with other indicators. If you think you are getting a good feel for the price behavior of the Vix and their derivative markets, then you have opportunities to trade it. If the possibility of trading one or all of these products piques your curiosity, check out the links under the references section.
Russell Rhoads is the author of Candlestick Charting For Dummies and recently joined the Options Institute at the Chicago Board Options Exchange as a course writer and instructor.