Trading Articles
Trading, Time Frames, And Trends By B.C. Low

Understand time frames and you will begin to understand the nature of the market and how to improve your forecasts. Technical analysis is used to forecast future price trends. Many technical tools focus on the task of defining a trend. Not addressed adequately, however, is the issue of what kind of trend is being defined. Is it long term, medium term, or short term? Time frames are important for traders. After you establish the trend of the time frame you trade in, the next step is to relate that to the trend of the next larger time frame. For example, if you established the direction of the trend on a daily chart, you would look at a weekly one to confirm the direction of the trend. Understanding time frames will make sense of trends between two time frames, especially when there are opposing trends. When that is achieved, you can improve your market forecasts.
TIME FRAME APPROACH DEFINED
It is a common practice for traders to look at markets in a single time frame. Traders typically focus only on the time frame they trade in, be it the hourly or daily charts. With the benefit of modern technology, charts are now available on time frames ranging from tick charts to five-minute ones to hourly, daily, weekly, monthly, and beyond.
The time frame approach is a technique where you analyze a market over two or more time frames. If you normally analyze a five-minute chart, you should analyze the hourly one as well. If you are a daily chart trader, you should analyze the weekly or even the monthly for comparison. This will help you better forecast the market and trade more effectively.
BENEFITS OF THE TIME FRAME APPROACH
First of all, a trader who knows the trend of the larger time frame of his trade gains perspective, especially if the two trends are opposites. A trader buying in an hourly environment is better informed of the risk if he knows that the daily trend is down. Eventually, the trend’s weakness will become evident, even though the hourly trend may be up in the short run. This is also true of the relationship between daily and weekly trends, between weekly and monthly trends, or between any adjacent time frames.
Second, the time frame approach makes it possible to develop a range of views of a market, from the very short term to the very long. An hourly chart provides a look at the market a few days into the future and a daily chart an outlook several weeks into the future, while a weekly chart provides an outlook several months ahead. A common myth that technical analysis is only good for short-term trades simply reflects the idea that many traders are not taking advantage of weekly and monthly charts that provide a long-term perspective of markets.
Suggested Books and Courses About Chart Patterns


Third, the time frame approach removes the confusion surrounding short-, medium-, and long-term views. What is short term for one may be long term for another. When you use the time frame approach, you just need to use a view of the trend by time frame; the hourly trend, daily trend, or weekly trend is up or down using whatever technical tool used. The challenge is to integrate the trends of two or more time frames.
TIME FRAME RELATIONSHIPS
What is the relationship between the larger and smaller time frames? Which drives which?
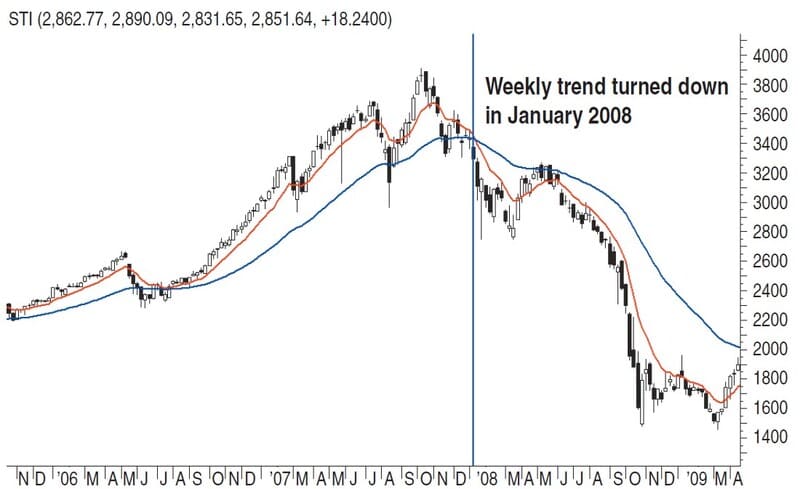
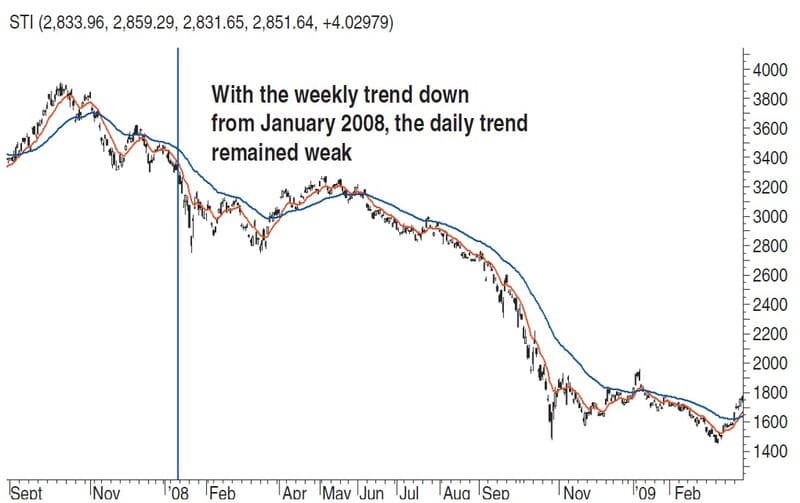
1. Primarily, the larger time frame drives the smaller one. When the monthly trend is down, the weekly trend tends to be weak, and this filters down to the daily trend. In the weekly chart of the Straits Times Index (STI) in Figure 1, the trend turned down in January 2008. This weakness translated into weakness in the daily trend, as seen in Figure 2. This tells you the trend is bearish, and hence it is not the scenario in which you want to place long positions. The importance of the relationship between the weekly and daily trends cannot be overemphasized. I used two exponential moving averages (EMA) to confirm the direction of the trend. An uptrend is when the 10-period EMA is above the 40-pe-riod EMA. A downtrend is when the 10-period EMA is below the 40-period EMA. A congestion is when the 10 EMA and 40 EMA cross each other repeatedly.
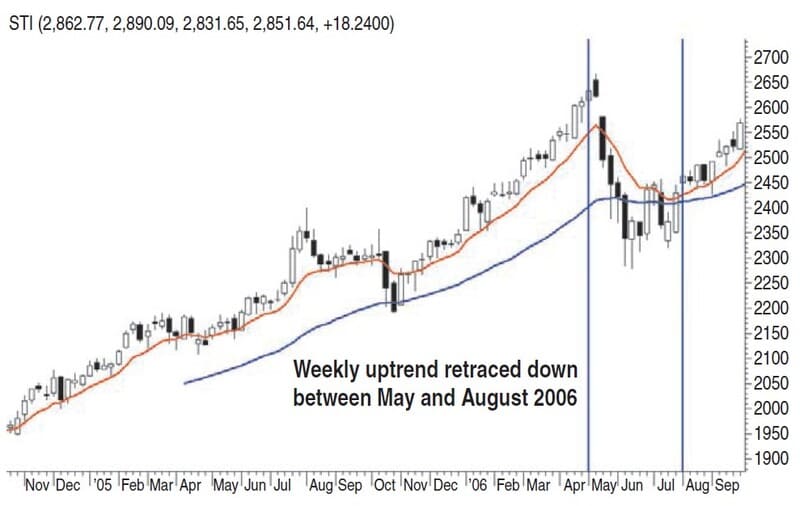
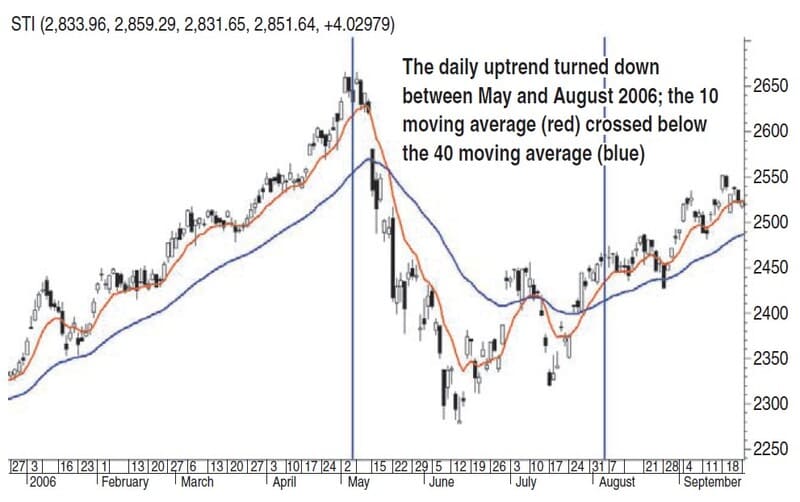
2. Despite the primary relationship, is it possible for the weekly trend to be up and the daily trend to be down? It certainly is. A retracement of an uptrend such as the one in the weekly chart of the STI in Figure 3 would drive the daily trend into a short-term downtrend (Figure 4). For short-term traders this may present opportunities to open short trades, but be mindful of support levels where that retracement could reverse. This will help you identify areas to exit your trades. Conversely, a retracement up in a downtrend on a weekly chart will cause a short-term uptrend on the daily chart. The same holds true between the monthly and weekly trends, and between other adjacent time frames.
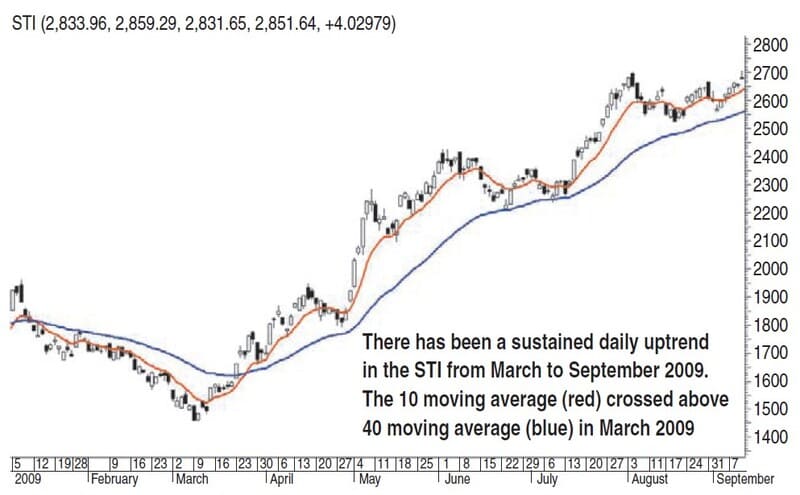
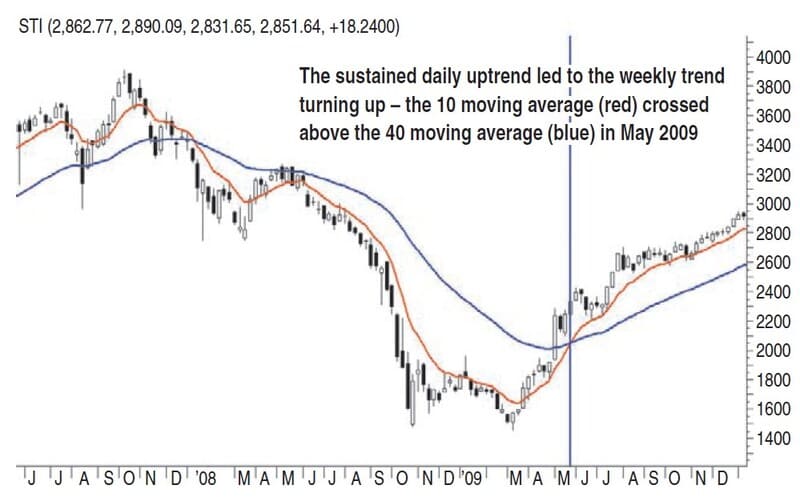
3. The third time-frame issue is whether a smaller time frame can influence a larger one. This is a valid question because given the first time-frame relationship, it is the larger time frame that drives the smaller one. How does the smaller time frame influence the larger? How can a daily downtrend turn the weekly trend up? It is possible only when there is a sustained change in the trend of the smaller time frame. In Figure 5, the sustained uptrend in the daily chart of the STI from March 2009 eventually led to the uptrend in the weekly trend in May 2009, when the 10 EMA crossed above the 40 EMA (Figure 6).
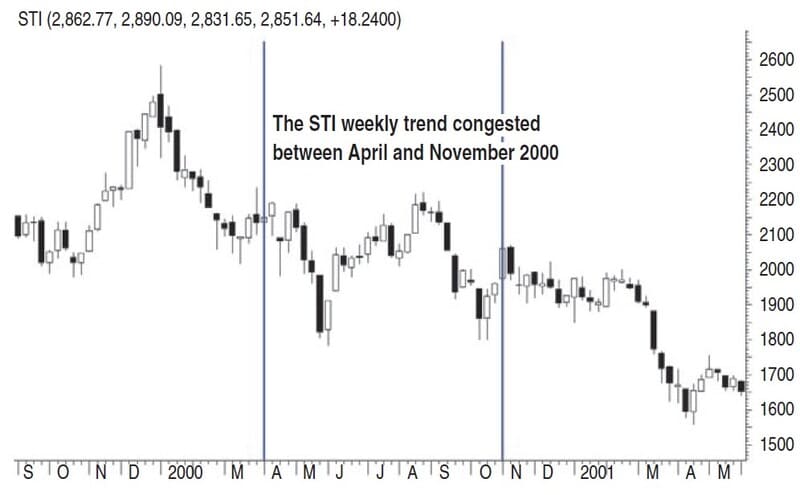
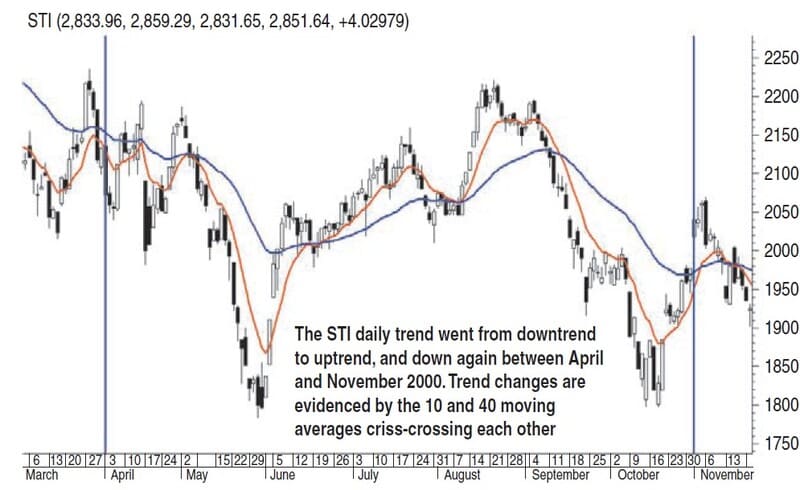
4. The fourth major time frame relationship is the effect that congestion in a larger time frame has on a smaller one. How would congestion on the weekly chart like the one you see in Figure 7 affect the daily trend? The daily chart will have a series of uptrends and downtrends (Figure 8). This sequence on the daily chart may be difficult to comprehend if you are not aware it is the result of a weekly congestion. Once you are aware that the market is in a congestion zone, you can trade long and short positions. One way to trade this type of market is to identify oversold and overbought zones using oscillators to help you determine when to enter and exit trades.
TIME FRAME GUIDELINES
These guidelines are important when practicing the time frame approach on your own:
- Analyze time frames in a top-down manner. Start with the larger time frame charts first, then work down to the smaller ones, not the other way round.
- Analyze different time-frame charts using the same indicators to achieve consistency. In the charts used as examples in this article, the 10- and 40-period EMA combination is used in both the daily and weekly charts.
- When the trend of a particular time frame is not clear, analyzing the trend of the next one or two larger time frames will clarify the nature of the trend in question. If the daily trend is not clear, the weekly chart will help clarify matters. If the weekly does not, the monthly will most likely do the job.
- Analyze different time-frame charts at regular intervals — weekly charts at the end of each week; monthly charts at month’s end, and so on. If you see a strong move take place on the daily chart, you can consult the weekly charts before the end of the week or month.
SIMPLE BUT CRITICAL
Analyzing time frames may be nothing new, but often we skip this before we place a trade. That’s a mistake. In addition to examining the time frames, you also need to be well-versed in basic technical tools. The technical definitions of trends, retracements, and congestions must be clear and consistent before you can embark on the use of the time frame approach. Once that is done, however, the approach will yield exciting results!
BC Low has been a teacher and practitioner of technical analysis since 1990. Low was previously a technical analyst at Merrill Lynch International Bank in Singapore and was awarded the Chartered Market Technician designation by the Market Technicians Association in 2000. Currently, he is a senior lecturer at Singapore Polytechnic, where he pioneered the teaching of technical analysis. In addition, he is vice president of the Singapore Technical Analysts & Traders Society.