Trading Articles
Trading The Russell 2000 Emini By Austin Passamonte

The Russell 2000 emini futures is a highly tradable instrument. Here’s a look at some of its advantages and disadvantages. The Standard & Poor’s 500 futures contract (ES) is the king of emini index futures markets. More traders trade that instrument than all other index futures combined. But popularity as measured by volume does not always mean that particular tradable is more profitable than others.
The S&P 500 futures contracts are the most liquid, most popular, and even most churned by black-box computer programs. The ES spends more time going sideways in consolidation patterns and/or pulling back inside directional periods than any of the other eminis, due to professional-level players working big orders that have nothing to do with accumulation or distribution patterns. Hedging to offset blocks of stock, SPY shares, SPX option positions, and intermarket positions such as ES/NQ (NASDAQ 100) spreads are all part of the intraday influence on S&P 500 futures.
In addition, numerous black-box programs exist solely for scalping sideways profit potential from ES markets versus something else. This could be the arbitrage spread between ES and SPY, ES and SPX options, or ES emini futures versus SP00S pit-traded futures and their mismatched bid/ask spreads — in other words, a lot of big-money positions trade inside the ES with no regard to direction. These program types work to keep price action sideways by arbitraging price discrepancies between different tradables. It is that constant pressure on ES that creates sideways price behavior. Some retail traders develop strategies to take advantage of that predictability. Overall, it is the most congested emini instrument with the least amount of straight-line price movement.
RUSSELL 2000 FUTURES
The most dynamic emini index symbol is the Russell 2000 (TF) contract. Based on small-cap stocks, it is a general market proxy and leading indicator to where all other index markets usually head. It has been a leading market indicator for years, and it will probably continue to be the ultimate broad market “tell.” More important, the TF futures contract is a highly tradable instrument. From inception through September 2008, it traded as the ER2 on the Chicago Mercantile Exchange (CME). Since 2008, it has listed on the NYBOT (ICE) as TF and trades apart from other emini index futures listed on the CME.
Russell 2000 emini traders worried that the ER2 leaving its home base at CME would ruin the contract. It did result in lower volume traded for a couple of reasons, one of which was the normal uncertainty that any change creates. Another reason was an explosion of volatility, which resulted in an implosion of stock markets right when the migration occurred. Former ER2 players were dealt dual variables of a new symbol and new exchange inside extreme price movement through the entire marketplace. That shifted many would-be TF traders into other tradables or sidelined them until the dust settled.
Before the migration, if ER2 was out of balance with ES or NQ, spread traders could short one or long the other, which would essentially rein in the ER2. That type of relationship no longer exists because margins are fractional within the CME products spread. In order to trade the same arbitrage spreads between ES/TF or NQ/TF, it requires two full margins for each spread position.
Further, when spreads within the CME were active but the exchange became inaccessible to outside traders for a short period, it was no big deal. But spreads open across two different exchanges where one of those could go offline might expose the other open leg of that trade to potential loss. Spread traders abhor risk, which is part of why they trade spreads instead of linear positions in the first place. For those reasons and more, emini spread traders pretty much leave the cross-exchange spread arbitrage alone. One major reason TF is considerably smoother and more directional than other eminis is the lack of sideways pressure.
LIQUID ENOUGH?
The average daily volume in TF is roughly 150,000 contracts, whereas the ER2 at its zenith averaged somewhere around 300,000 contracts daily. Compared to many futures contracts, current TF volume is substantial. TF contracts offer enough liquidity for the average retail trader with minimal slippage. Larger orders will clear on a regular basis, but partial fills on a single strike are possible with limit orders during lulls. TF traders wanting to push block-size orders can stagger orders across several ticks’ span for complete fills in most instances.
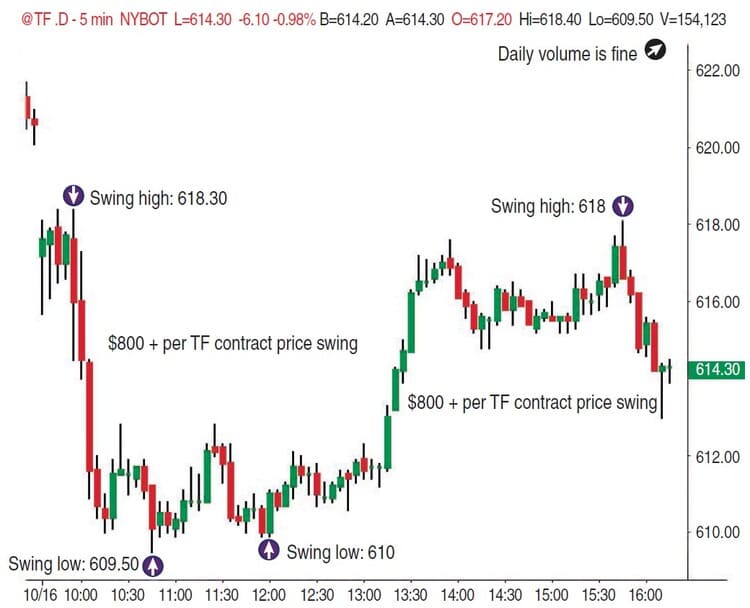
The bid/ask spread varies from one tick to two ticks, occasionally more, around economic reports and other market-moving events. With a value of $10 per tick and 10 ticks per index point, this may seem rangy. However, TF price swings commonly run four to 10 points from low to high, making everything relative. An initial stop of -1.5 points/-$150 per contract with realistic expectations of profit exit for five points/$500 per contract (or greater) offers an unparalleled risk/reward ratio (Figure 1).
SMALL-MARKET INFLUENCE
Russell 2000 futures serve as a market maker’s hedge for IWM shares and/or baskets of bigger small-cap stock positions. The RUT index options and IWM options are secondary derivative instruments for hedging stocks and iShares or creating sideways trade strategies for Russell 2000 products. The numbers shown for RUT index options are thin volume and open interest relative to SPX (and OEX) index options based on S&P 500 index futures pricing.
So there are limited ways for Russell 2000 index traders to work in sideways strategies compared to the S&P 500 or even NASDAQ 100 indexes. The two big indexes each have numerous products for intermarket hedging strategies, and that is why TF futures have straighter, more directional price movement compared to the ES and even NQ. A market working higher from point A to B or the reverse can do so in a more deliberate fashion if it has less sideways pressure. The ways that S&P markets are gamed sideways for arbitrage strategies inhibit straight-line movement. The ES/SPY will eventually go from A to B or B to A just like anything else. But the path to get there will always be more ragged.
TF BID/ASK SPREAD
Many former ER2 traders are either watching or dabbling with the TF contract. Bid/ask is too wide and erratic before 9 am Eastern time for premarket trading in TF. During the cash session, price whipsaws of three to five points can and do occur around the open and close. These whipsaws happen in mere seconds, leaving no time for trade decisions to be made.
TF SLIPPAGE AND FILLS
Of course, there are reasonable size limits to how many TF contracts can be traded before persistent slippage becomes an issue. Someone trying to fill 20 contracts opened long or short on limit orders will experience numerous partial fills on profitable trades. That’s the tough part. Losing trades will always fill complete orders because the market is moving against you. You can fill hundreds of contracts between entry and stop if the market is at 500.00 and falling with your buy-open order (499.00 – stop 497.50) if it trades down to or below your stop.
On the other hand, if the same scenario sees TF price action trade to 498.90 and there are 100 contracts offered resting at 499.00 to 498.90 collectively, and your 20-lot to buy open order is part of 150 waiting to fill in the same span, someone in that collective group will not get filled the extra 50 contracts above open interest available on limit orders. Market orders to open will be completely filled with some degree of slippage involved.
Suggested Books and Courses About Commodity and Futures
What commonly happens with bigger orders will be, for example, a -1.5-point loss on 20 contracts on the first trade, a zero-point loss on 20 contracts on the second trade, and a five-point gain on 12 contracts on the third trade. The first trade went -$3,000, with the second trade a scratch and the third trade $6,000 gross. Sounds fine overall, but the winning trade should have been $10,000. Remember, there is never a problem getting complete fills in any market on losing trades when price action moves against you.
It’s a simple matter for retail traders to fill small block orders across several ticks to ensure complete fills. If you’re trying to short 20-contract lot positions at the 500.00 level to open, a trader can stage 10 contracts at 500.00 and 10 at 499.80. If the market is trading below there and an expected fill occurs with a price rise into the 500.00 trigger, half the position would easily fill before that trigger was hit. Thus, if price action stalled out just below 500.00 and then dropped dead, you would have half a short position open to profit from that move instead of none on a no-fill situation.
If price action rises through 499.80 and into 500.00, it would easily fill your entire order. The net average fill would be 499.90 blended, giving up roughly one tick to ensure the entire block gets filled. Should price be trading above 500 but fall through your trigger, the entire position would fill as the price dropped. Staging orders to enter on pullbacks lessens the possibility that partial fills would occur. No one is going to fill TF 100-contract lots regularly without significant slippage or partial fills. However, it is not likely that anyone reading this article would be stumped by dealing with 100-lot TF flips anyway. That’s all part of why TF futures are more trend-prone and directionally oriented than other eminis. They are relatively unfettered by the sideways hedging tactics of big-money players.
Fundamentally, TF futures are too illiquid for massive commercial arbitrage and sideways strategies, and that is what appeals about the TF emini market for many retail traders. It is too small for limitless big-money manipulation but big enough for retail traders to profit from.
LEADING MARKET INDICATOR
Stock market traders search for leading indicators or signs about where the market is headed next. Various markets have had some influence on the broad stock market at times, but they have all failed to have any effect on leading the broad market at other times. Such relationships are always temporary. Whereas the price of crude oil rising once pushed stock prices lower, rising crude prices now signal that stock markets will head up as well. Why? Well, when crude oil prices were at nosebleed levels, it was considered inflationary pressure on the overall stock market. It was also used as a hedge for USD prices versus other currencies. Currently, oil no longer imparts pressure on stocks. Instead, it is viewed as a barometer to the overall economy’s health.
The same has been done for gold futures at other times. Currency pairs like USD/JPY track the carry trade, which affected stock market behavior for a while. None of those temporary market-influence tools can be relied upon for years of dependable leading indications of what the general marketplace — that is, indexes — will do next.
FAVORABLE RANGE
Looking at the stacked chart from October 13, 2009, in Figure 2 shows an opening price swing lower for both ES (top) and TF (bottom) emini futures markets. The ES price swing high began near the 1072 level while the price swing low ended around the 1063 level. That nine-point range at $50 per index point resulted in a total range of $450 per ES futures contract. The maximum of potential profit from within that price move was less than $450 per contract.
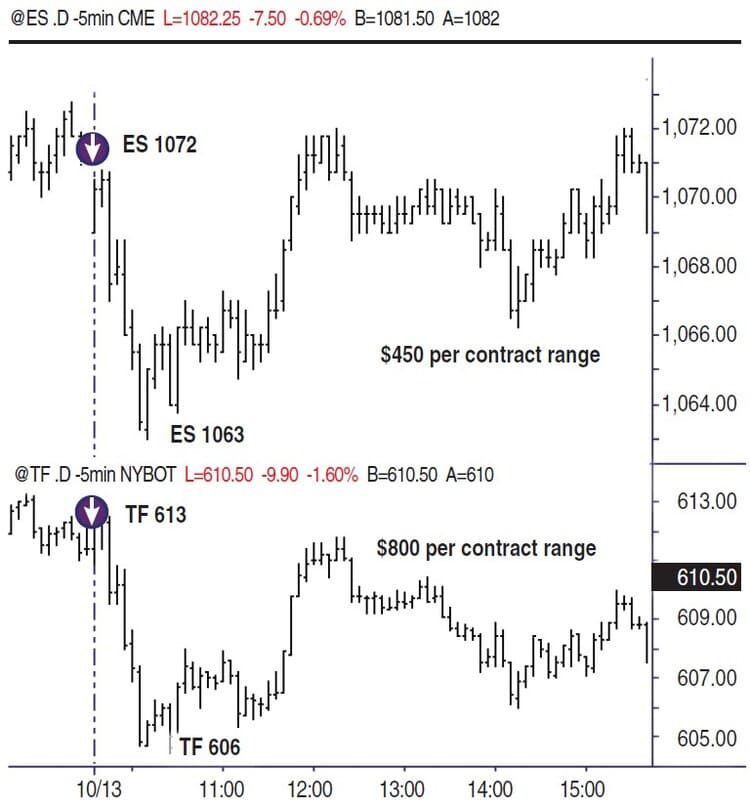
By comparison, the TF price swing high began near its $613 level while the price swing low ended just below its $605 level. That eight-point range at $100 per index point resulted in a range of $800-plus per TF futures contract. The maximum of potential profit from within that price move was near $800 per contract.
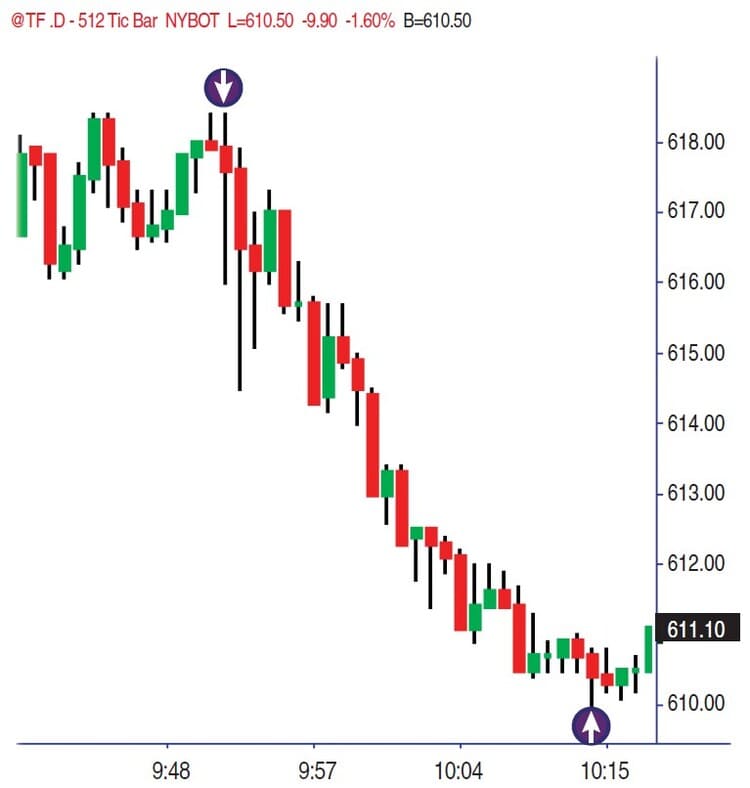
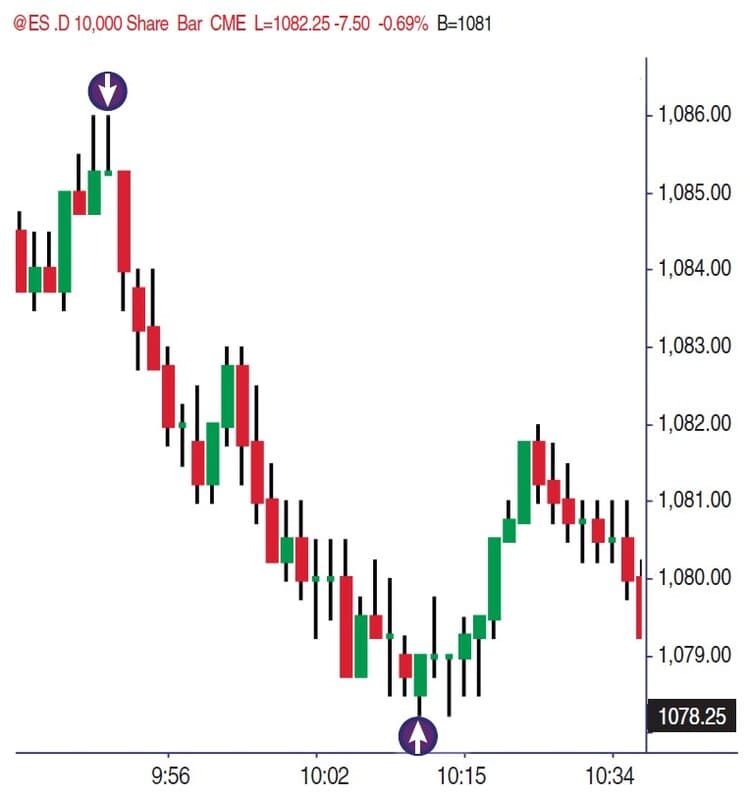
Is it déjà vu all over again? October 16, 2009, saw an opening price sequence of TF $618-plus highs at the peak to the $610 low in the range (Figure 3), a dollar-per-contract value of $830 price range. By comparison, the ES swing high near $1,086 and swing low near $1,078.25 covered near a $387.50 price range (Figure 4). Both are stock index futures, and both traded in the same direction at the same time. But there is a significant difference in how each instrument travels, in that one is more expansive while the other is congestive by nature.
Not only has that black-box influence over ES markets continued, it has become much more prevalent. Intraday ranges have contracted greatly from fourth-quarter 2008 to 2009. Intraday volume has slipped from roughly three million contracts traded per session to less than two million. Historical volatility and unprecedented market events that culminated last year created similar levels of volume in all stock markets; that’s a given. But for whatever reason the volume and volatility existed last year, it did so for the benefit of traders.
It doesn’t matter why last year’s volume and range were outsized. That created far easier conditions to profit from the range covered. When a trade was entered successfully, held its stop-loss protection order, and moved off in favor of the entry, it often moved big. That type of range expansion is forgiving. A trader can get stopped out twice for -2 points each time in ES, and then the third trade may go 10 points, 12 points, or even 20 points from entry to swing peak before turning. Somewhere in that expanded range, ES traders can erase the -4-point cumulative loss with a bigger, profitable result.
FITS TO A T
Russell 2000 emini futures are back and as good as ever for retail traders. They do have limitations and pitfalls, just like any other financial market or instrument traded. It goes without saying that there is no perfect or superior tradable in all regards. If there were, everybody would trade that one and nothing else. For those who like directional, dynamic, and expansive price action, however, Russell 2000 emini futures fits that description to a T.
Austin Passamonte is a full-time professional trader who specializes in emini stock index futures and commodity markets. His trading approach uses general technical analysis and proprietary chart patterns. He trades privately in the Finger Lakes region of New York.