Trading Articles
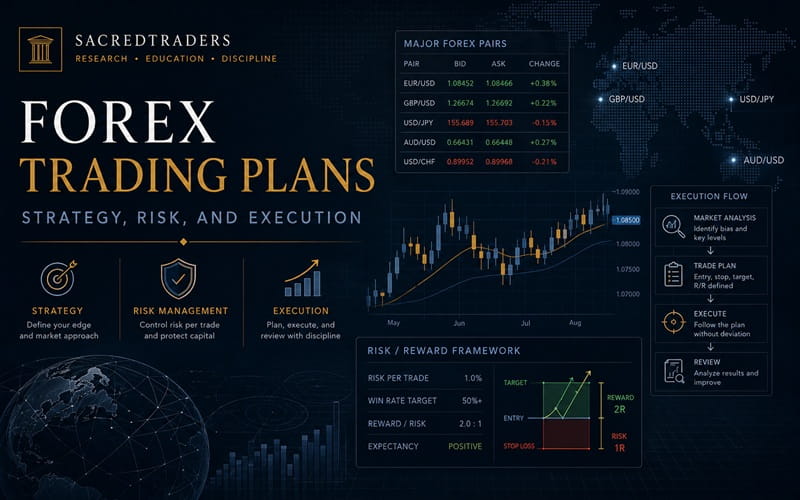
Forex Trading Plans: Strategy, Risk, and Execution
Planning your trading strategy requires a thorough understanding of the market you wish to trade. If you’re going to trade the forex markets, the first step is to understand how certain markets are interrelated. One of the most important relationships to watch in the currency markets is how the various pairs and crosses are correlated with price movements in commodities especially. A correlation is, as the name tells us, a relationship between two things. In the financial markets, correlation means that an equity, currency pair, commodity, or market moves predictably along with another. Correlation can be positive, in that when A moves up, so does B; or it can be negative, meaning that when A increases, B decreases (and vice versa).
Economic Factors
A simple correlation is the price of oil to the US dollar. Oil is traded on the global market in dollars, so when the dollar weakens, the price of oil increases. That’s because the same barrel of oil is worth the same amount of money in euros or yen today than it was yesterday (all else being equal), but now it takes more dollars to equal that number of euros or yen. Of course, many other market factors affect the price of oil, but the exchange rate of the dollar is an important one. This, by the way, is a negative correlation: when the dollar falls, oil rises. Just to throw a small piece of knowledge from a college logic class at you, be aware that correlation does not mean causality. In other words, just because two things change at the same time does not mean one necessarily causes the other. While that might be the case, sometimes there is an unseen third factor that is the cause behind both correlated changes. Financial market correlations exist for a number of different reasons. Common ones are economic factors, trader sentiment, risk, and economic institutions. I’ll consider some specific examples for each.
While a weakening dollar affects oil prices for institutional reasons (the dollar denomination of the oil trade), as we’ve already discussed, there are also economic factors that drive those prices. As the US is responsible for about 25% of global oil consumption, it is the 600-pound gorilla of the oil market. That means US economic conditions and level of oil demand directly affect supply, which—as basic economics teaches us—sends prices higher when demand rises and lower when demand falls. Disproportionate US oil consumption has even further-reaching ripples, however. Despite all the hoopla about Middle Eastern oil, the number-one exporter of oil to the US is Canada. When more dollars flow to Canada to purchase oil, it means more US dollars have to be traded for Canadian dollars, which strengthens the Canadian dollar against the US dollar. Remember, however, that this effect on the exchange rate only kicks in when oil export levels change markedly up or down, since equilibrium will be established when export levels are stable. So US oil demand and the Canadian dollar are positively correlated.
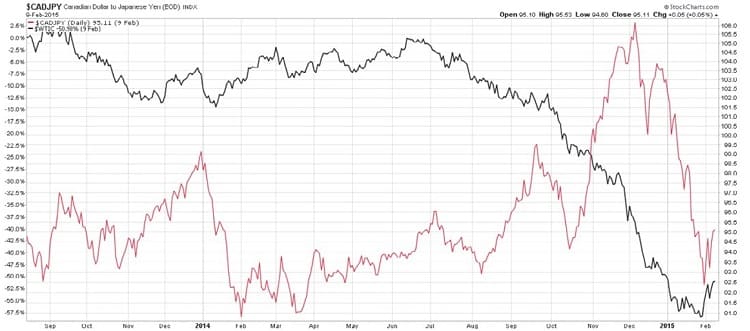
Japan similarly imports almost all of its oil, so the CAD/JPY currency pair is correlated with oil prices as well. The Canadian dollar will strengthen against the yen when oil prices rise and weaken when oil prices fall. You can see from the chart in Figure 1 that in December 2014 the Canadian dollar weakened against the yen, which was when the price of oil started to drop drastically.
Another well-known correlation—negative in this case—is gold with the US dollar. The dollar is a global safe haven, but gold is considered by many to be the ultimate safe haven. Any currency, even the dollar, is just a piece of paper that has value only because everyone agrees it has value. Should things go to Hades in a hand basket, currencies would become just pretty pieces of paper, but gold has intrinsic value. So when the markets worry about the dollar, what you often see is a flight to gold.
Interestingly, the Swiss franc is positively correlated with gold, for a number of reasons, including Swiss gold reserves and its banking system. The collective tolerance of the market for risk also strongly affects certain investments. The Australian dollar is a notable one. Normally, the AUD/JPY pair is a great candidate for the carry trade (a forex investment that profits primarily on interest rate differentials) because Australian interest rates are typically much higher than Japanese rates. With a 4% differential (which is not uncommon) and 20:1 leverage, you stand to make 80% a year on your cash outlay just in interest.
Ah, but while that sounds great, it carries a risk. That 20:1 leverage also means that a small downward movement in the currency value is magnified so much that it can wipe out your profits or even leave you with a loss. So when traders are feeling confident and willing to take on risk, they will flock to the AUD/JPY pair and drive up prices. A fearful market will flow out of the pair and send prices down.
So where does that fearful market head? Fear produces a flight to quality, which usually lands on American shores. So when geopolitical or economic dark clouds gather, the US dollar tends to strengthen. This is why during the 2008 financial crisis, as bad as things looked and as fast as the US mortgage market was imploding, the dollar still rose.
There are a couple of ways to identify currency correlations. A simple one is to graph one currency pair against another or against another investment, like a market index, gold, or oil; this is something you can do easily with any charting software or even on Google Finance. An example of a handy currency correlation table available from OANDA can be seen in Figure 2.
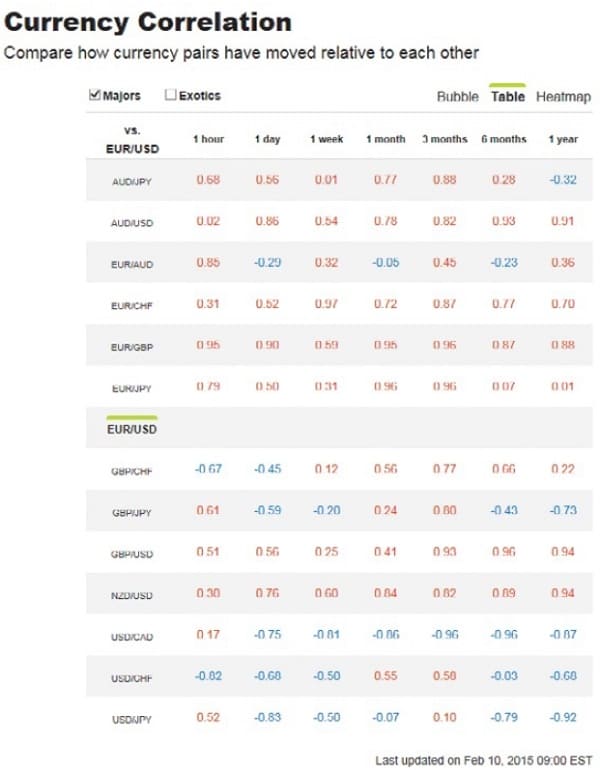
For each pair you will see an indicator of correlation strength for different time frames:
- 0 to 0.2: negligible to very weak
- 0.2 to 0.4: weak
- 0.4 to 0.7: moderate
- 0.7 to 0.9: strong
- 0.9 to 1.0: very strong
A positive number means a positive correlation; a negative number means a negative correlation.
Advanced Books and Courses on Risk Management and Position Sizing

Trader Sentiment
Financial markets—forex markets included—are nothing more than collections of human beings pursuing a similar activity. That’s why you so often hear discussions of market sentiment, even though markets don’t have emotions. For that reason, I prefer the term trader sentiment. As it turns out, there’s a way to measure that sentiment.
While individual traders tend to act in the spot market, large traders, like institutions, central banks, and multinationals, often trade currency futures—that is, after all, a big part of how multinationals hedge currency risk. In the US, the futures market is regulated by the Commodity Futures Trading Commission (CFTC), which requires large traders to make a weekly report of their positions. The CFTC then combines those individual reports to generate the Commitments Of Traders (COT) report.
The COT breaks traders into three categories: commercial, noncommercial, and nonreportable. Commercial traders are in the market for business reasons, like hedging currency risk. Noncommercial traders are speculating, and the non-reportables are, well, not worth the bother, because they are too small to move the markets.
The COT then reports open interest (how many currency futures contracts are for sale), short interest (the number of short contracts available), and long interest (you can probably guess this one). Strong short interest means an expectation of a currency decline, and the opposite is true for long interest.
In this sense, the COT can function much like the relative strength index (RSI) does in equity trading: It shows whether a particular pair is overbought or oversold. While a currency pair that becomes overbought or oversold will eventually correct, the key word is eventually. Knowing the exact timing of that event is the trick. The noted economist John Maynard Keynes has a great quote about market sentiment:
The market can stay irrational longer than you can stay solvent.
The point is that the market doesn’t always move based on the fundamentals or the technical indicators. Traders can take or hold positions for reasons that don’t appear rational, at least in the short term, and those traders may continue to act in what appears to be an irrational manner until after they’ve run out of money.
The COT presents a lot of information, but there are certain areas that are most important to watch. In each category (such as dealers and asset managers), you will see the number of long and short positions, the change in each number since the last report, and the percentage of open interest that those numbers represent. The key indicator is what change takes place week to week and in what categories. If, for example, the total number of open contracts were reduced, then both long and short contracts would decrease, but it is quite likely that one will decrease much more than the other. The point is to identify the trends to see where trader sentiment is heading. Of course, sometimes it heads nowhere. If open and short interest remain balanced, the market may move sideways for a little longer.
Developing a Trading Plan
A long-standing bit of wisdom in trading is, “Plan the trade and trade the plan.” The point is to remove emotion from trading as much as possible so that fear & greed—the two big motivators—have minimal impact. Since we’re all human and can’t just switch off our emotions, the way to best achieve this is to plan each trade before you put money on the line, deciding where you’ll enter and where you’ll exit, and then sticking with that plan. If you don’t believe this can be effective, consider that many new forex traders do great when they’re trading with fake money in a demo or practice account. But when they start putting real money on the line, suddenly those great results go out the window. That’s because having money at risk is psychologically different and they start acting based on emotion.
Financial markets – forex markets included – are nothing more than collections of human beings pursuing a similar activity.
Understand that you will be small fry in the forex markets. Major players and institutions have more money than you ever will, and they have access to resources you can only dream about, including high-speed trading networks, proprietary software, and the inside track on valuable information that you’ll never see or only see too late. The only way to mitigate their advantages is to have a definite, tested plan that you follow. Your trading plan must address at least five key areas:
- Concrete goals: Concrete goals are not vague. It goes without saying that your forex trading goal is to make profits, but you need to establish what your specific profit goal is in terms of pips per trade. This allows you to determine whether a given trade is worth entering.
- Risk tolerance: How much risk you’re willing to accept is a personal matter that depends on a lot of things, including your own psychology and the depth of your pockets. (Don’t bet the mortgage payment on a forex trade!) Determine in advance the maximum amount of capital that will be allocated to any one trade, no matter how much of a sure thing it looks to be.
- Trading schedule: We’ve already talked in this article series about the forex markets being open almost 24/7. Even if you don’t have a full-time job, you need to sleep, eat, and do things besides trade forex. Decide in advance when you will trade, based on what best suits your schedule or personality. If you’re consistently bleary in the morning but at your best in the afternoon, accept that and work with it.
- Data selection: There is a tremendous amount of data on which to base forex trades. This is not just a matter of fundamental vs. technical, either. There are hundreds of technical indicators, for example. The bald truth is that you can’t analyze all of them, let alone learn to use them effectively. Your trading strategy must choose a reasonably limited set of indicators and focus only on them. Don’t be led astray by some discussion of a hot new indicator—trade what you know.
- Trading criteria: Some basic criteria have already been addressed, such as how much money you will allocate to one trade and the minimum profit you require to pursue a trade. Other criteria will further filter your trading opportunities. Maybe you only want to trade the major pairs. Maybe you only want to trade EUR/USD and USD/JPY. Maybe you only want to short the downside of Elliott wave patterns. Whatever your criteria, set them and adhere to them.
Importance of Journaling
If you want to measure the success of your trading strategy, you’ll also need some sort of record. This is what is called a trading journal. It’s human nature in many cases to remember the successes and forget the failures, and over time this can distort your view of your strategy. But let’s face it, if something isn’t working, you’ll want to know so that you can make appropriate changes. The trading journal provides an objective record on which to base those decisions.
At a minimum, the journal should record for each trade what your plan was; what the trigger was for entering it; and what happened. Note the planned result (in terms of dollars of profit) versus the actual result. Add any explanation of what definitely went wrong (if anything, and if you know) or what you think happened. It’s also important to keep track of your emotional state—maybe you didn’t feel right about exiting the trade when you did, but you stuck to your plan. How did that work out? What would have happened if you had followed your emotions instead of the plan? Over time, this can be a valuable lesson in the importance of trading the plan instead of trading your gut. Once you’ve got a good-sized set of data, you can do some valuable analysis. Here are some basic statistics that should be extracted and constantly updated:
- Wins vs. losses: Just as with an NFL coach, this is a key performance indicator.
- Net profit: Don’t forget to subtract any expenses, such as trading platform subscriptions.
- Average profit: On average, what do you earn from a trade?
- Average win: What is the average profit from all successful trades?
- Average loss: What is the average loss from all failed trades?
- Best pairs: Which currency pair or pairs have produced the best results for you?
- Best indicator: Which trading indicator or indicators have produced the best results for you?
You’re The Decision Maker
Honest evaluation of your trading performance is the best way to improve. Keeping emotion out of the equation is equally important. Now that you have an idea of what is required to trade the forex markets, you can see why it’s easy to be excited about the prospect of forex trading. However, keep your enthusiasm on the sidelines when it’s time to make trading decisions. Go to any football game and you’ll notice that they don’t have the cheerleaders calling plays!
- Imran Mukati is the Managing Director of fixed income securities at Fairbridge Capital Markets,