Trading Articles
Trading Companies With Split Personalities By Anthony Trongone

When the regular trading session gains momentum, is the market more likely to produce additional gains? Here’s how the companies in the QQQQ perform during regular trading sessions versus overnight trading sessions. Although seven years have passed since then, the trades based on my two 2004 articles about the advantages of taking a long position in the overnight session are still delivering attractive profits. In these articles, I made a case for splitting the trading day into two separate sessions. By trading in the hours of darkness in the three years I investigated (2001–03), shares of the NASDAQ 100 Trust exchange traded fund (QQQQ), also known as the cues, made $1.69 in aftermarket activity but fell $23.61 in the regular trading session.
Since then, the cues, which were at $36.46 on December 31, 2003, ran up to a closing price of $54.46 by December 31, 2010. Despite this $18.00 advance in 1,763 trading days, the regular session (subtract the day’s closing price from its opening price) had a decline of $9.86; however, the overnight session (compute the price change in the overnight session by subtracting opening price of the next trading day from today’s closing price) was able to advance $27.86.
This article explores the possibilities of the cues making a turnaround in the regular trading session (RTS) by showing how to monitor the running performance of each trading session. With a 62.5% weighting in the information technology sector, the cues have no exposure to the financial industry. Since they have an average trading volume of more than 100 million shares, they offer some outstanding advantages. With such vibrant activity, they normally trade with just a penny difference between the bid/ask price. This liquidity is an important feature because very few instruments offer the investor a reasonable bidding price to buy or asking price to sell outside of the regular trading session. In addition, this exchange traded fund (ETF) allows investors to participate in the collective intraday performance of the 100 companies that compose the NASDAQ 100; however, it trades with the precision of a single security.
Because the cues track the prices of the companies in this index, they have an almost perfect correlation with the NQ futures. This allows you to actively trade this futures contact as a replacement for the cues during the day or throughout the night. This contract trades internationally, around the clock, at a dazzling speed with small differences between the bid/ask price.
SPLIT PERSONALITY
Not all of the 100 companies in the NASDAQ 100 perform better after hours. Some demonstrate success during the day, but falter badly at night. For instance, Figure 1 shows the performance of 13 companies. (Prices come from Yahoo!, so there is no adjustment for dividends.) Although it is a small representation, those companies are responsible for 47.5% of its weighting as of September 1, 2010. In selecting these stocks, I took those with the biggest percentage weightings, along with a few other familiar names.
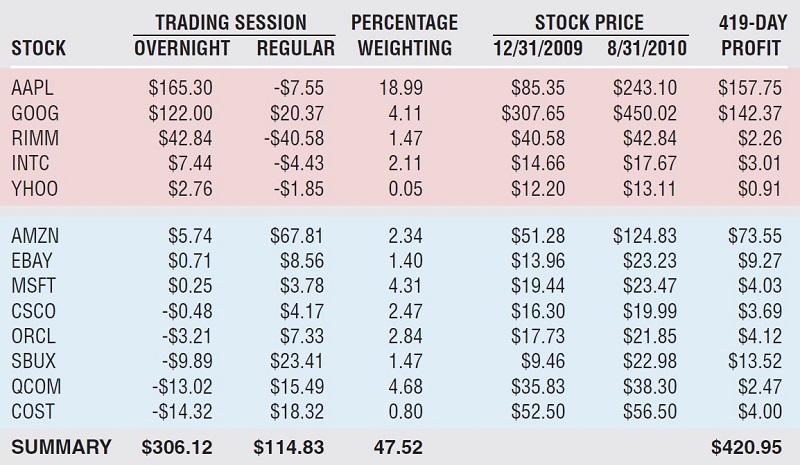
Two stocks with a long history of success are big contributors to the advance of the overnight session. Since January 1, 2009, Apple Inc. [AAPL] has gone from $85.35 to $243.10 (as of August 31, 2010), but how much of its profits came during the regular trading session (from the opening to the closing bell)? Absolutely nothing! Despite this amazing run, it was unable to turn a profit in the regular trading session.
A more historical pattern belongs to Google [GOOG], which began trading at $100 on August 19, 2004. After the closing bell on October 14, 2010, with the announcement of its latest earnings reports, it shot up within 60 minutes, leaving it just pennies shy of $600. The stock has had a spectacular run, but despite this $500 advance, it could still be trading in the red if only examined during the regular trading session.
Figure 1 breaks down each of these 13 companies by the more profitable session. In many cases they appear to have a split personality. When this occurs, it can obscure the true results of the stock. For instance, Research in Motion (RIMM), the maker of BlackBerry wireless smartphones, is an interesting case. Without separating the sessions, its $2.26 profit appears meaningless. But splitting the trading sessions offers the insightful investor a remarkable advantage, as this company had a $42.84 profit in the overnight session (OVS) while falling $40.58 in the regular trading session.
TRADING AFTER DARK
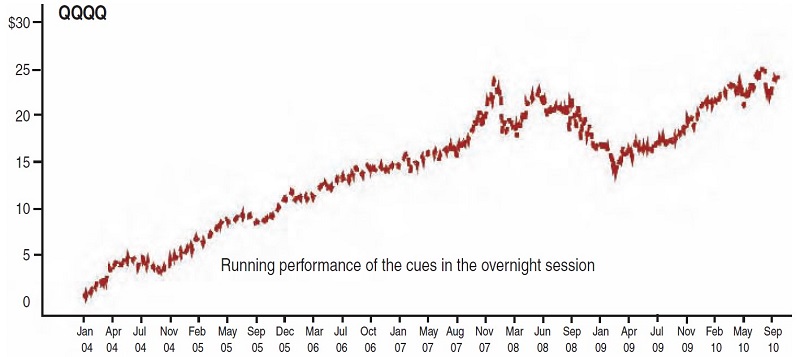
Figure 2 shows the extensive run by the QQQQ to the upside in the overnight session. As you can see, it was mostly an uphill journey. During the financial crisis, the cues took a nasty fall, slipping from $55.03 (October 31, 2007) to $25.72 (March 9, 2009). Surely, a $29.31 decline will have a negative impact on both sessions. The OVS did not escape unscathed, losing approximately a fifth of its price ($6.01/$29.31 = 20.51%) in those 339 trading days. The overnight session takes on significance because its performance is reflective of premarket economic reports in the morning (generally at 8:30) as well as afterhours company earnings reports, and the reporting of international economic breaking news, which often take place after the US markets close for the day.
MONITORING SYSTEM PERFORMANCE
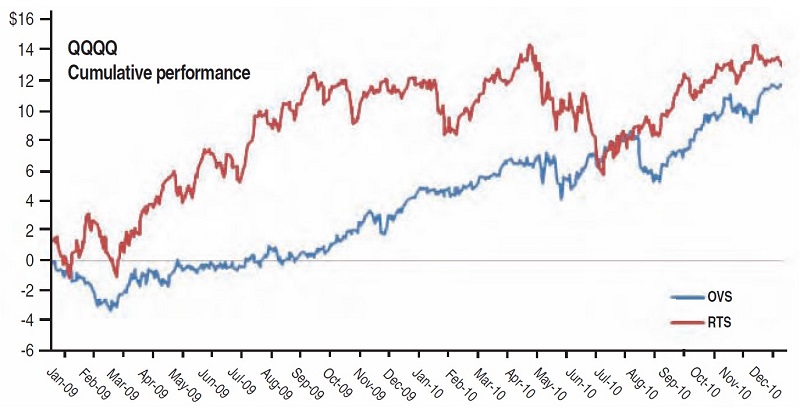
In my articles, I caution the reader on the perils of trading any system without periodically monitoring its results, because no system works consistently across all economic settings. Although this system has enjoyed a remarkable run, the more active session may become the dominant force. If this occurs, how can we position ourselves to capitalize on this opportunity? By maintaining a running summary of a session’s daily price change, you can keep an accurate account of its ongoing pattern. Figure 3 displays the daily cumulative performance of each session from the start of 2009 until December 31, 2010.
Suggested Books and Courses About Trading Stock Market
You can easily monitor performance by adding the daily price change for each session to its cumulative results. For example, let’s assume that over the previous 200 trading days, the daily price change in the regular trading session is $10. If the stock advances 50 cents, this would increase the cumulative price change to $10.50. The blue line indicates the cumulative results for the overnight session; the red line, which has the superior performance record, represents trading during the day session.
CHANGING WINDS
Figure 3 shows the beginnings of a shifting pattern. In looking at the performance from January 1, 2009, to December 31, 2010, we see the regular trading session had the better run; however, most of its $11 advance came at the tail end of a lingering bear market. After sitting on the sidelines, momentum traders, watching the market recover, frantically began putting their cash to use by going on a buying spree. As the rally continued, buying activity was indicative of the positive turnaround. Once the bull entered the ring, the cues at $25.74 rallied to $30.90 in 10 trading days with 173 million shares per day. This growth spurt put a $12 spacing between the sessions in autumn 2009.
After pushing above a $12 cumulative profit, the regular trading session of the cues began trading sideways in a $4 range. After penetrating this upper range, it went racing toward $15. Shortly after reaching this peak, the cues fell hard, crashing to $6 before getting back to their winning ways in July 2010. However, the cues had to break through their previous watermark ($14 price target) before getting back on track.
While the regular trading session was racing ahead, the overnight session had difficulty breaking even. The OVS advance, however, was slow but steady, with minor setbacks, whereas the advances in the RTS were more impressive but with greater volatility. Can we use the RTS as a reliable yardstick to determine future performance of the cues? When the RTS begins to rally, is the market more likely to produce additional gains? That’s difficult to say. Unfortunately, there are not enough of these settings to confirm this theory.
DIFFERENT PATTERNS
Not all companies establish a long-term preference for a particular session. Our concern is with those companies that have an existing performance imbalance between these two time frames. Going forward, they will either sustain or reverse their preference for favoring a particular session. The easiest to play are those companies that retain their current direction, such as showing strength in the OVS but weakness in the RTS. Nevertheless, there is always the possibility that the less profitable session will overturn the results by outperforming the more attractive one. A regression toward the mean occurs when a variable with an extreme performance score loses its fizzle and it regresses to its average. This phenomenon often produces negative results for momentum traders but opportunity for contrarian investors looking to take positions against the grain. When employing this strategy, your technical experience in reading chart patterns contributes greatly to your ongoing success, as early detection of an alteration in this pattern will make the difference between success and failure.
PREDICTING A SUSTAINABLE RALLY
There is always the possibility the regular trading session will outperform its rival, but on a long-term basis, I will not believe this until there is conclusive evidence. Of course, with the cues in the vicinity of their highest price before encountering the beginning of a bear market (October 31, 2007), the possibility of not breaking past resistance is always a technical concern.
Besides the prospect of previous resistance, another factor to consider is the rising cost of some commodities (mostly agricultural products and industrial materials). With the global economy still facing fiscal uncertainty, an infl ationary environment is certain to have a negative impact on the stock market. If this is the case, you may be long the better-performing session, but playing this strategy when the market is going down will still produce losses in your account. Nevertheless, by tracking the performance of each session, it is easier to be proactive and make the necessary adjustments.
Anthony Trongone has taught graduate courses in psychology, as well as graduate courses in finance, investing for capital appreciation, and quantitative analysis in the US and across Asia. As one of 25 Master Educators for eSignal, he regularly writes articles on current investment strategies.