Trading Articles
The Trend Is Your Friend By Alexander Sabodin

The fundamentals of technical analysis have been discussed to great lengths in the past. This includes topics such as support, resistance, trendlines, and channel lines. Now we can move one step forward and begin to study the graphic models of these different types of charting tools. One of the tenets of technical analysis is that price movement is subject to trends. One glance at a price graph will reveal its distinguishing feature: Price is always moving. This movement gives you the opportunity to make money. The old saying “the trend is your friend” is important for every trader.
Analysts have noticed one more specific feature of price movement: A trend reversal does not occur instantaneously with a wave of a wand. In most cases, a trend slows down and stops before reversing. A pause occurs in the movement — a transition period — after which the trend continues or reverses. During transition periods, various price configurations occur, which allow you to predict further price movement. I refer to these price formations that regularly emerge in price charts as models.
These price formations reflect the mass psychology of market participants. Since they are based on human psychology, which does not change over the years, the formations may be divided into certain groups and used to predict further dynamics of the market. In this article, I will go over some of the general characteristics of price formations.
1. The condition for any model is the existence of the previous trend. The previous main trend is the most important requirement for any model. After all, there needs to be a trend for a reversal to take place. (See the downsloping trend in Figure 1.) Even for a continuation to occur, a trend is necessary. Sometimes, a type of formation that resembles a reversal model can be seen in a price chart. But if there were no trend preceding the model, there would be no reversal. So anything that resembles a reversal would be a false alarm. As a result, when it comes to differentiating models, one of the key elements is to be thorough in your knowledge of areas within a trend structure.
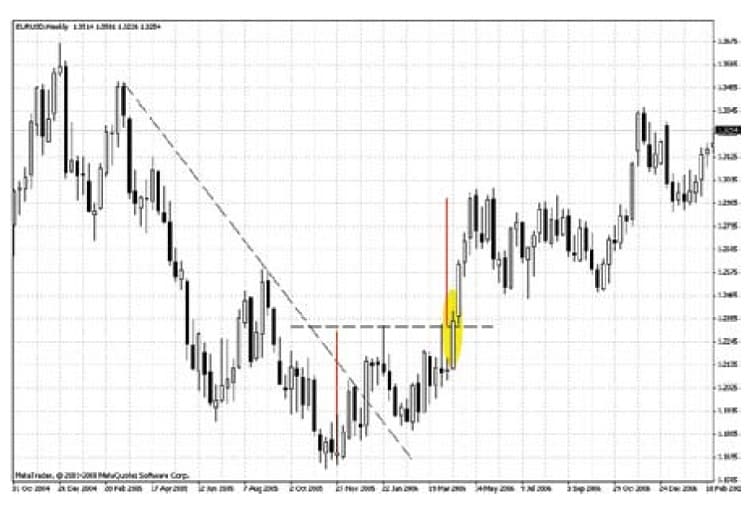
2. The first signal of the oncoming reversal in the existing trend is often a breakthrough of an important trendline. Note the breakthrough of the downward trend in Figure 1 at the end of 2005. It is a good idea to keep in mind that any distortion of the main trendline does not always signal a trend reversal. Think of it as a change in trend dynamics. A breakthrough in the main descending trendline may just be the formation of a horizontal price model. Whether it is a reversal or price consolidation will only become clear later. Of course, it goes without saying that the breakthroughs of the main trendline do sometimes coincide with the completion of a price model formation.
3. The larger the model, the more significant the following movement. What I mean by “larger” is the height and width of a price model. The height is shown by the red vertical lines in Figure 1. The width is identified by the horizontal dashed line. Height determines the volatility level of the model — that is, the extent of price variation during the formation of the model. The width corresponds to the time period it takes for the model to be formed and completed. The larger the model, the wider the price range within the model (volatility, or variation). The longer it takes for a model to be formed, the more important the model is. In other words, the following price movement will be more powerful.
Suggested Books and Courses About Trend Trading


4. Price models help to predict the target. The maximum target for a reversal is the beginning of the previous trend. So any reversal that is preceded by a trend gives you an opportunity to qualitatively evaluate further price movement. There are several model measurement methods that allow you to define short-term price movements such as support and resistance levels or Fibonacci retracement levels. But the length of the longer-term reversal point equals the entire length of the previous trend. If, for example, the main ascending trend has been prevailing and a top is being formed, it means that the maximum price movement after the trend reversal will be 100% of the distance of the price move during the bull market — that is, price will, at most, return to the level where the ascending movement began.
5. A price breakthrough must be strong and vigorous. To explain this expression, price should “fly out” like a cork out of a champagne bottle. This would prompt most traders to follow this breakthrough. Note on Figure 1 (that is, the area highlighted in yellow) that “long” candle bodies confirm the breakthrough of the resistance line, thus increasing its confidence.
6. Increased volume at breakthrough indicates movement. An increase in volume shows market participants’ interest in the price movement. This suggests that while volume was growing, traders were paying attention to the movement. More and more market participants want to enter the market. The volume increase indicates that the pressure on prices — which makes them change — is growing. The rule of thumb is that volume should rise in the direction of the current price trend. In an upward breakthrough, volume should increase as price grows, while at a downward breakthrough, volume should increase as price falls. In the case of volume in the currency markets, market value is conditional enough.
7. After a breakthrough, if price returns within the candle body (closing price), there is a strong likelihood of a false breakthrough. Sometimes, after a model is completed and a reversal starts, a short-term price surge up to the level of the price model line may occur. This occurred toward the end of 2006 (Figure 1). This type of movement may be slight. In order to differentiate a “true” breakthrough from a “false” one, you must go back in time on the chart to determine if the level where the short-term price surge occurred has any significance. Short-term surges with candle shadows are not particularly significant, but if the candle body remains inside the price model, there is a high probability of a false breakthrough. You can see in Figure 1 that after the reversal at the end of 2006, prices surged again but then reversed. There was a long candle body that remained within the price model. In such a case, you should close positions with minimal losses to protect yourself against a larger risk.
Keep an Open Mind
Now that you have an idea of the general characteristics of price models, I will go over some price models in more detail in the next articles. I would like to end this first part of the series by giving you one practical recommendation. While working with price models, please keep in mind that any model must be seen with a naked eye. Do not look for signals where there are none!
Alexander Sabodin is a private trader, analyst and advisor for the forex currency market from Belarus.