Trading Articles
Random Walk Theory in Financial Markets: An Analysis by Ron Davis
Most indicators are correlated to the cyclical movements of the market. Here is an indicator that can identify trends without considering where in the cycle the market is located. Nearly all technical indicators depend upon the ever-changing cyclic content of the market to generate information. When the indicator is synchronized with the current market cycle, the signals are timely. If the indicator is misaligned, however, the signals will be out of phase and thus useless.
When it was first proposed, the random walk index was an attempt to generate cycle-free trend identification. Here’s a look at what the random walk really is, how it fits with other indicators, and an expanded trading diary to show how it works.
BACKGROUND
In the early 1990s, E. Michael Poulos wrote a series of articles for STOCKS & COMMODITIES in which he introduced the random walk index. The concept was borrowed from the probability theorist and teacher William Feller, wherein it was referred to as a “drunkard’s walk.” In his honor, I will refer to my material thus. Feller posed the question, “If a drunk leaves the lamp post he is leaning against, how far would he have gone, on average, after n steps?” The answer is he would have gone the square root of n multiplied by the average length of his stride:
√n * Average length of stride
Using this solution, Poulos constructed his random walk index by creating an up walk and a down walk, then comparing them against each other and with a random walk. The up walk is constructed by subtracting the lowest price of the last n periods from the current high. Let’s call that “up distance.” Count the number of periods from that low point to now. Call that k. Finally, compute the average true range (ATR) for the k periods:
Up walk = (Up distance) / (√k * ATR)
Repeat the process for the down walk, substituting the highest price and current low into the up walk. The denominator is in the equation to make the up and down walks comparable to a random walk and to walks taken from other price series. Without the denominator, you could not compare the readings in the gold market with those in the currency market, nor the currency market with the stock market, and so on. When either series is above “1,” Poulos viewed the market as trending in that direction. The goal of all this was to create a parameter-free way to trade. I have worked with a number of permutations of the ideas and found none that, standing alone, made a good, robust system. What I found instead is that the approach can generate useful oversold (OS) and overbought (OB) information, especially when put beside a standard OB-OS oscillator.
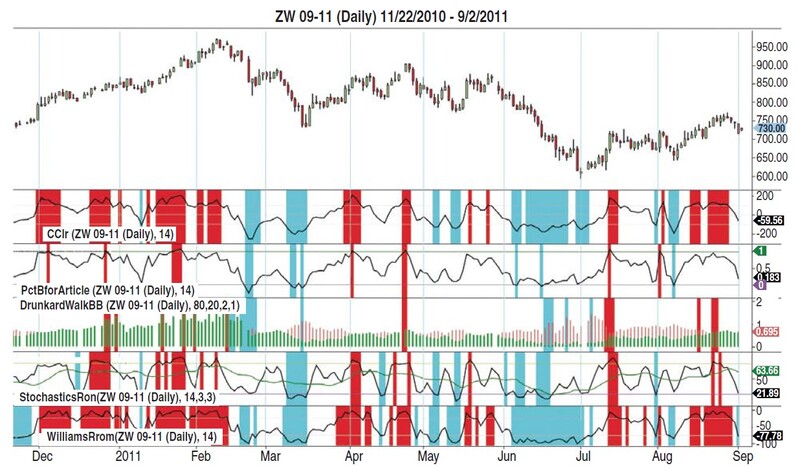
Figure 1 shows that all the OB-OS methods generate the same signals if set to the same time frame. The methods shown are stochastics, %b, drunkard’s walk (DW), commodity channel index, and %R. John Bollinger’s %b is not part of the standard charting package. The computation is: %b = (Close – LBB)/(UBB-LBB) where LBB is the lower Bollinger Band and UBB is the upper band. “TradeStation Code For Pct_B.” The areas marked red on an indicator shows overbought areas, while oversold areas are marked in cyan.
The DW overbought/oversold signals in Figure 1 were generated by using Bollinger Bands on the up walk and down walk. Cyan areas show that the down walk exceeded its upper Bollinger Band; red is displayed when the up walk penetrated its upper Bollinger Band. The DW contains additional information. “TradeStation Code For DW.”
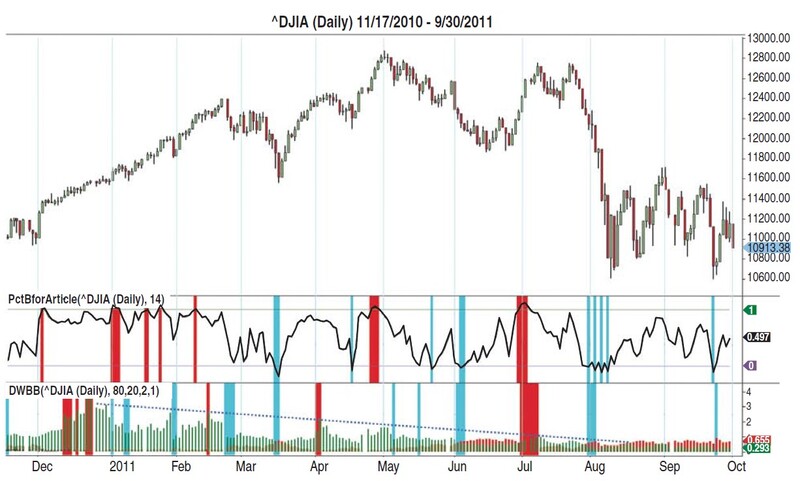
In Figures 2 through 5, while keeping the red–cyan scheme, the charts will display yellow when the down walk drops below its lower BBand; they will display blue when the up walk has dropped below its lower BBand. The overlay of the two walks makes it easy to see which one is larger, and usually you can see the difference.
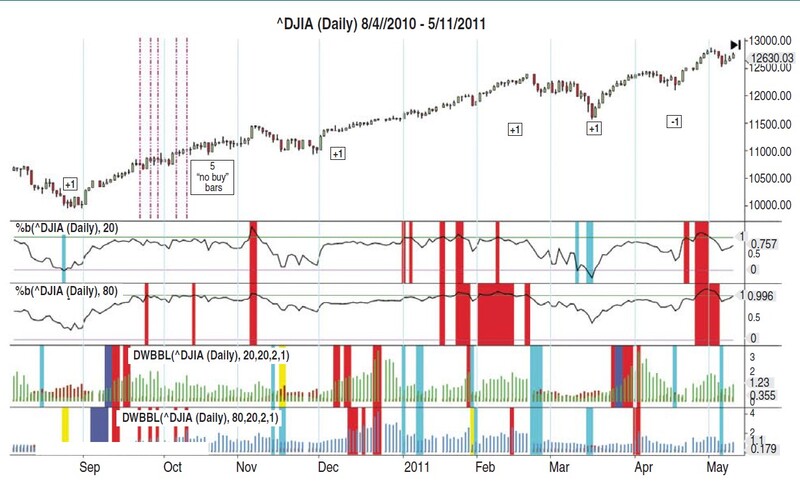
In Figure 2, %b and the DW are shown at a 20-bar lookback (top pair) and an 80-bar lookback (bottom pair). The longer DW loses some salient information but gains four items. However, the %b loses information at that setting and gains none. The DW and %b both contain information about the direction of the trend. The %b above the midline corresponds to the up walk being larger, and below the midline it corresponds to the down walk being stronger. Similarly, the 20-period up walk corresponds closely to the %b; I find the %b to be more crisp and easier to scale using zero and 1. However, as you can see from Figure 2, the DW contains information not found in either the 20-period or 80-period %b.
USING THE DRUNKARD’S WALK
The examples here all focus on using DW with %b. My approach is to view technical studies in relationship with price action. I will keep price action analysis to a bare minimum. When DW and %b agree on a condition — oversold or overbought — the situation is clear. The action each trader chooses depends on his or her own approach. It is worth noting that many strong moves begin with either OB or OS readings.
Trendlines drawn across the walk are useful (Figure 3). Fading rising trendlines are not very profitable. A better approach would be to use corrections as opportunities to get in or to add to your position. Adding to your position when the DW trendline is down is riskier. You are usually safe if both indicators read OB or OS. When the indicators diverge, look at the slope of the DW for guidance regarding probable future direction.
A TRADER’S DIARY
In Figure 4 you see an annotated version of my trading chart for trades 1 to 5. The chart is the hourly emini contract for June 2011, using 24-hour data. Since I don’t trade around the clock, most of the trades shown are only for US pit hours, using Pacific time. I use the 20-period exponential moving average (EMA), shown on the chart, as a comfort reference rather than as a trading tool. I have included some prospective trades from non–US trading hours to illustrate ideas I think are important. I’m not an aggressive trader, and I’m sure you’ll see lots of opportunity.
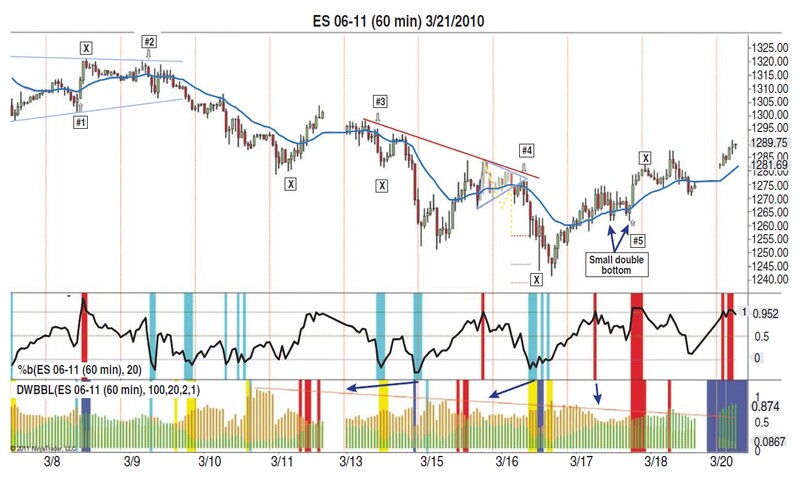
Here are the explanations of each of the trades:
Trade 1, March 8, 7:00: The prior bar was blue on drunkard’s walk — an oversold reading. The %b may be a higher low than its two prior lows. The downward motion of price would have stopped if this bar goes up and moves closer to the short-term trendline. In this situation, I buy the up breakout. Almost immediately (in two hours), the indicators read overbought so I took profits on the close, but you could use a different exit approach.
Trade 2, March 9, 6:00: The early morning, pre–US session bars traded down to the moving average, only to be followed by a weak rally. The general slope to DW is bearish and %b is showing weakness. This is an uncomfortable trade because the third bar has a wide range followed by a rally. The best result is to exit on the open of March 11. By that point, the drunkard’s walk has shown both a yellow, “up walk falling too fast” impression and a cyan oversold reading, and the %b has generated a higher oversold reading, hence divergent from the major thrust of the day before. The brown down walk is also much weaker. All this alarms me, so I exit on the first higher high at the “X.”
Trade 3, March 14, 8:00: In the non–pit session trading, the DW was pushed into several bars of overbought and %b was nearly overbought. The presession morning trading was down, with a rally into the US opening. The first lower low of the US session was at 8 am, and that was where I shorted. Again, I was out after the 10:00 oversold reading, but the better trade was to hold the position until the next morning. The European session drove prices into a deeply oversold area, and the price action was a small double bottom. More aggressive traders might have gone long with the upward breakout that came shortly after the opening.
Trade 4, March 16, 7:00: Both indicators pushed into the overbought range during the prior 24 hours, and prices are again near the down trendline. A big plus for me was the wedge or triangle. Prior to the New York open, prices returned to the lower line of the triangle, and then the day’s first bar brought a breakout down. I included a standard wedge measuring for this trade. The dotted red line is 100%; the blue line below is 161%. Those lines correspond to winning 16 and 26 points, respectively. An aggressive trader might consider taking a long position between trades 4 and 5. That possible trade would have started in the Asian/Australian session and been ripe for exiting midmorning in the following US session. The basis of the trade was the downsloping drunkard’s walk, which indicates a weakening of trend, nearby oversold readings in both indicators, and divergence from price in both.
Trade 5, March 17: This trade is imaginary, with both entry and exit occurring during the Asian/Australian session. It is included only for illustrative purposes. The reasoning is that DW down walk has been decreasing for the past two days or more, as noted by the trendline across the tops; and divergence between price and %b (%b is lower while price made a small double bottom) and the two DW walks are about equal for the first time since March 9. Thus, buy the breakout, exit on the oversold reading.
Advanced Books and Courses on Algorithmic & Quant Trading


Trades 6 to 10 are displayed in Figure 5.
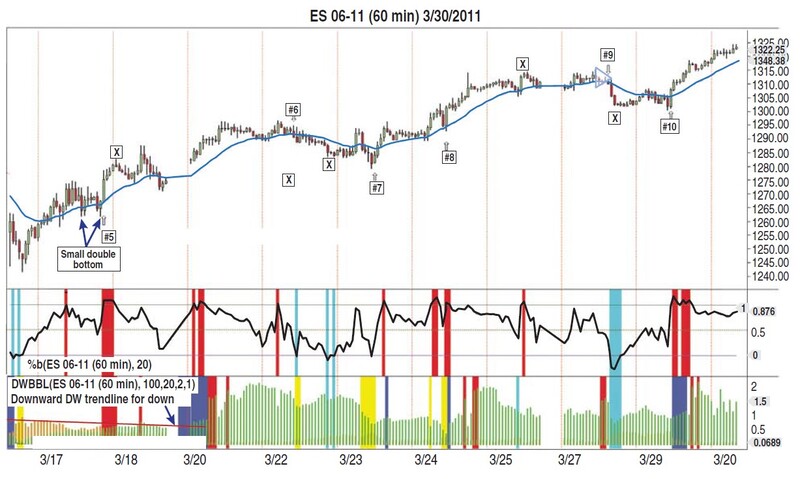
Trade 6, March 22, 7:00: Price and DW made a double top. The %b had a higher high, with the second high pushing into the overbought zone. This combination is set up with above-average safety. I shorted the breakout down; 1282 was my target price, but the deeply oversold %b and oversold DW around 1284 persuaded me to exit.
Trade 7, March 23, 9:00: At this point, I was thinking in terms of another leg in a longer bull run. My estimated price target was 1325. The DW generated an oversold reading not shared by the %b, often a bullish condition. I did not exit on the overbought condition at the end of the session. The next trade was to add to my position.
Trade 8, March 24, 8:00: The 7:00 bar was a scary decline out of an overbought %b reading and a considerably weakened DW. The up swing generated a higher high, so I left my capital protection stop in place and put in a buy for above the 7:00 bar. If the stop is hit, it could generate a nice bull trap and some upward momentum, and that turned out to be the case. At 9:00 on March 25, another overbought at a prospective double top was too much for me and I closed my position.
Trade 9, March 28, 12:00: Prices had not been able to move much in either the Asian or European sessions. The DW generated an odd overbought reading and the %b was implying price weakness. There was also a small triangle, which is a formation I like to trade. I shorted the breakout and exited at the end of the day. This sudden, short selloff was enough to generate oversold readings on both indicators — an exit for me.
Trade 10, March 29, 8:00: Oversold on the DW (at my previous exit) with a rising tide in %b and a double bottom in price made an easy-to-find setup. I bought the breakout upward and then exited at my original target of 1325.
Perhaps the random walk index was not effective as a system because despite the intentions of the originator, it is not a cycle-free indicator. That is clear from comparing John Bollinger’s %b with the same-period random walk index. With respect to trend identification, the two are virtually identical, but the drunkard’s walk makes information contained in the random walk index clear but previously untapped. We have also seen that the newly used information captured in the drunkard’s walk is closer to being cycle-free, as demonstrated in the comparison between the 20- and 80-period DW charts and the %b charts. The trading diary I have walked you through will allow you to decide whether the drunkard’s walk could be useful for your own trading.
- Ron Davis is a member of the peer review committee for the Journal of the Market Technicians Association.