Trading Articles
The Laws Of Momentum By Dirk Vandycke
Before I get started, I want to bring to your attention that in this series of articles, I will be discussing the cash and equity markets characterized by a relatively stable free float (that is, the number of existing shares in a market available for transactions) and semi zero-sum effects (semi, because of trading costs). I won’t consider option and futures markets here, since the number of contracts or open interest, as it is often called, is far from steady, and time plays a bigger part.
Here in part 1 of this series, I’ll focus on price gravitation. It’s one of the most important drivers of market dynamics, and this force accounts for asymmetric volatility, market cycles, and lots more. Another major force in equity markets is a capacitive force on emotions, which links stock price movement to emotions. There are several reasons for detaching the underlying principles from the visible effects seen on charts. First, it’s helpful to know the underlying currents of the market. Second, the effects might be interrelated in that there may be several causes for a price move, or one cause may have several effects. Diving into the underlying principles also allows me to develop a mental framework to understand markets and differentiate between what is valid and what is just popular hearsay. This enables me to focus my attention on what is relevant.
Newtonian Finance
We’re all familiar with gravity. In the financial markets, there is a similar force that I refer to as price gravity. Its existence can be deduced solely through logic that originates from a basic axiom: A price quote is the result of a transaction. It is the price at which the last-traded shares changed hands. It’s the point at which an ask met a bid or vice versa. Suppose that a trader—let’s call him “Trader S” (for “seller”)—originally bought 100 shares of stock for $10 a share. This is a total sum of $1,000 that has to be paid. Now, for a higher price to make it to the tape, some other trader—we’ll call him “Trader B” (for “buyer”)—will have to meet that new (higher) ask price, which means Trader B will have to come up with more money. If the price jumps to $1,100 because of that transaction, then Trader B has paid $100 more than what Trader S paid.
You can deduce several things from this. First, if prices are to keep going up, more money is needed. If all those who are interested in purchasing the stock have already bought the stock, there’s nobody left to buy. Even though the availability of money does not guarantee that prices will go up, it’s a necessary precondition for prices to be able to go up. In the opposite scenario, no money is needed to see prices go down. Whatever Trader B bought for $1,100, he can get rid of for $900 without any monetary constraints.
This is price gravity in the markets in its purest form. Some of that money may be on margin, but it is money that is reserved or borrowed. To the seller who gets the money, it’s irrelevant if it came as cash or from a loan on the buyer’s side. We all know too well that prices go down faster than they go up. It’s like a rock having to be rolled up a hill slowly. But once it’s up there, it can be thrown off the cliff with the simple push of a finger.
Suggested Books and Courses About Chart Patterns


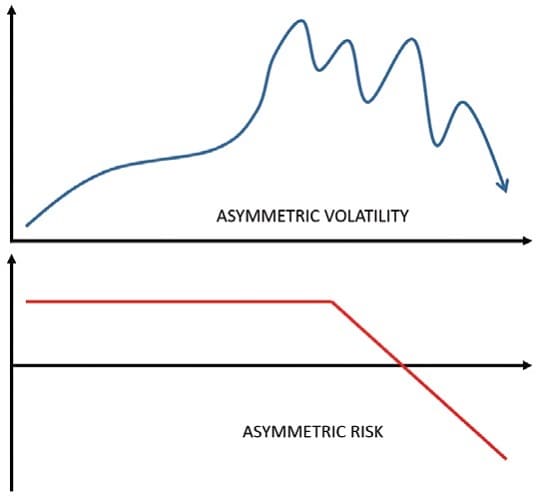
Second, price gravity might well be the reason behind the asymmetry in volatility. The top diagram in Figure 1 theoretically represents how markets are less volatile during rising markets and are more volatile during declining markets. It appears that conditional volatility in equity markets is negatively correlated with returns. This can also be seen in the chart of Apple Inc. (AAPL) in Figure 2. I added the average true range (ATR) to this chart to see how it responds to uptrends and downtrends. The ATR skyrocketed when the stock turned to the downside from September 2012 to February 2013. In the chart of asymmetric risk in Figure 1 (lower chart), you can see how downside risk is higher than upside reward.
Third, although the media often talks about value evaporating in crashing markets, no money ever disappears. When Trader B pays $1,100 to Trader S, the money merely changes pockets. If, after that, B sells his shares for $900, S still has $1,100 in his hands. In effect, the only thing that happened was that $200 was extracted from that market. This is why money flow or flux exists. Sometimes net money flows into markets, while at other times, the net money flows out from the markets. This brings me to the next law in equity or cash markets.
Emotional Capacity
Money is always in flux in the markets, but the number of existing shares is a different story. Given that the number of shares is semi-constant (leaving aside capital increases and stock buybacks), a simple axiom holds the basis of a conservation law, which is that the one property that does not change as markets evolve is emotional capacity. I’ll start with the observation that a stock always needs to have an owner. In almost all occasions, this is a physical person or some financial vehicle. In the markets, shares only change hands. In fact, when you buy or sell shares, you always do so from or to another prospective owner. In this regard, shares normally aren’t exchanged with the company they are representing.
Price gravitation is one of the most important drivers of market dynamics and accounts for asymmetric volatility, market cycles, and lots more.
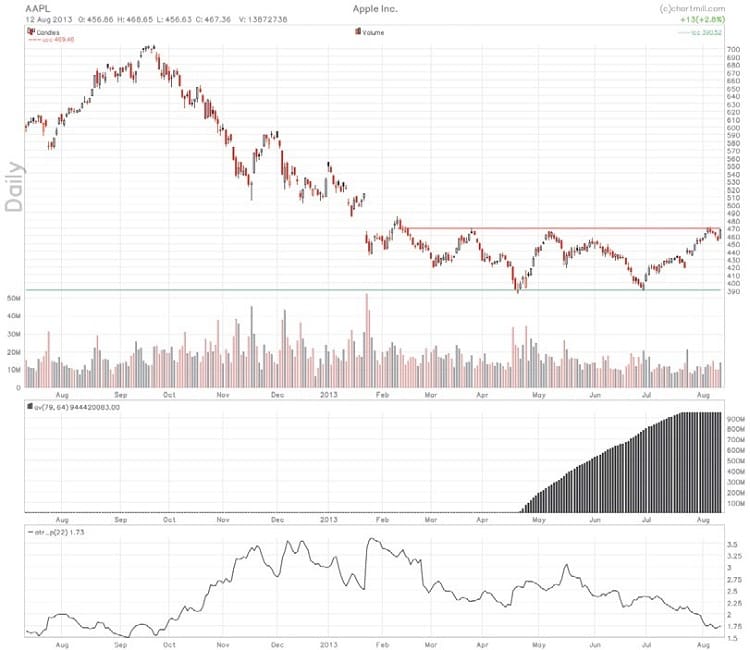
What does this have to do with emotions? From Figure 2 you see that the lowest price on the chart was on April 19, 2013. At that time, no shareholder on the time frame displayed on the chart had a profit on AAPL. The cumulative volume subchart below the price chart shows that before price hit rock-bottom, all the free float had been accounted for. That means the stock would have had to be bought at a lower price, which is impossible because the lowest price was already set. This means that each share of AAPL represented a loss. From that time, shares were changing hands without a new lower price being hit. In this process, shares went from the hands of owners holding it for a loss into the hands of owners who never experienced the downtrend to the lowest price. In mid-June, the total accumulated volume since the lowest price had reached the free float. That was the earliest time when owners of AAPL could have been those who had never participated in the downtrend leading up to the April low. The stock took off to meet the horizontal resistance channel one last time before breaking out of it. There’s no way to know if the stock will break through resistance, but if it does (which it did), you have a low-risk, high-probability setup. After that entry point in August 2013, AAPL appreciated more than 75% in 17 months.
Measuring Emotion
The bottom line is that someone owns stocks. Determining the volatility of a stock, the emotional capacity of those who own the stock, and how those shares are changing hands can help you measure the emotions surrounding the stock. One interesting measure of emotions is the volume-weighted average price (VWAP). This should also put in perspective the way technical analysts use previous gaps and support & resistance levels. These only work up to the point of accumulated volume and perhaps the effect of some self-fulfilling prophecy. In the second part of this series, I’ll delve into some more market physics and dynamics.
Dirk Vandycke has been actively and independently studying the markets since 1994 with a focus on technical analysis, market dynamics, and behavioral finance. He writes articles and develops software partly available at his co-owned website, www.chartmill.com. He holds master’s degrees in both electronics engineering and computer science, and he teaches software development and statistics at www.howest.be, a Belgian university.
Excellent idea.