Trading Articles
Spherical Wave Filters By Richard Johnson
Why do Elliott wave patterns develop in price data? This may be the reason. Of all the geometric forms, the sphere is the simplest. On a two-dimensional plane, the sphere is displayed as a circle or ellipse. The exact center of a circle is its radius point, which is precisely halfway between any opposite surface points. The radius is in turn half of the diameter of a circle, and it is its center of mass. On a two-dimensional chart where time is displayed linearly from left to right on the x-axis (the horizontal axis in a plane coordinate), a circle cannot be displayed because it would indicate a regression in time as its curvature took it backward beyond the horizontal.
The Bell Curve
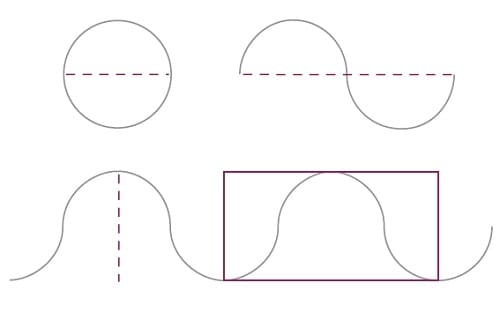
To display a circle in linear time, you need to dissect it from left to right to create two sequential and equal half-circles (Figure 1). Here we will pick up the extreme left edge of the bottom half-circle and rotate it until that edge is the extreme right surface. This creates a sine wave. By continuing the process with more circles, you end up with undulating sine waves. These waves can be considered to be linear expressions of nonlinear circles. If you segment any of these sine waves by dividing it at an extreme bottom and at the next extreme top, you will have created an S curve. If you continue from that point at the top and segment at the next extreme bottom, you would have created another but opposite S curve. When you join them all together, the famous bell curve is displayed. So the bell curve is really nothing more than a parsed segment of undulating sine waves with the basic geometric form of the circle as the source.
With the y-axis representing population magnitude and the x-axis representing variation from mean, the bell curve represents the typical distribution of biological attributes that are characteristic in nature. The bell curve shows that nature repeats for most of a biological population. This is graphically displayed in the wider body of the bell. The small numbers at the flanges represent extreme variants, nature’s way of providing an insurance policy of sorts in case there are significant environmental changes.
Elliott Waves
Waves, even those originating in stock market data, are manifestations of nature’s laws. As displayed in the bell curve, this principle describes the continuous vectoring on price charts. You could say that waves exhibit an inertial bias from their beginning toward their eventual destiny of growth, maturity, and completion. This explains why we observe trends in all human endeavors, and most specifically in markets.
Suggested Books and Courses About Elliott Wave Analysis
Going back to the circles, if you join two horizontally bisected circles together, you get two complete revolutions of a sine curve (Figure 2). Starting from the left edge of the bisecting line, you draw a straight line up to the highest point of the first half-circle, another line down from there to the lowest point on the next half-circle below the line, up again to the highest point on the next half-circle above the line, down again to the lowest point on the next half-circle below the line, and up to the right edge of the dissecting line. Next, you bisect a single circle horizontally but start by drawing the first line down to the lowest point of the half circle and continue with the process.
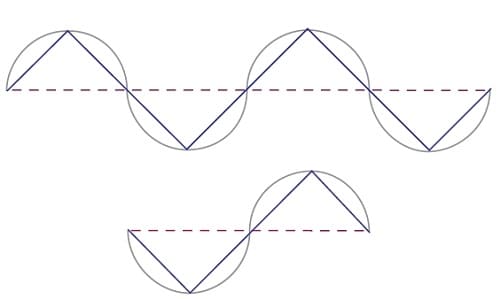
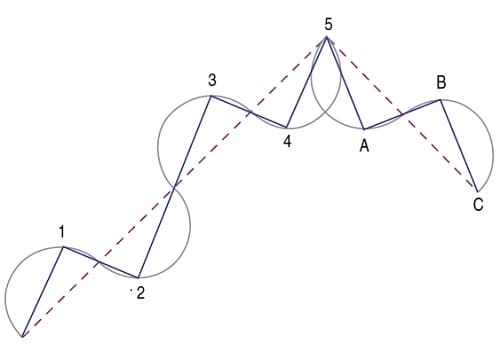
As shown in Figure 3, if you tilt this figure up at an angle (here at 45 degrees) and go through the process again, finding the highest and lowest points now at different places on the half circles, you would have created the familiar Elliott five-wave impulse pattern with an elongated third wave. Now you know why the Elliott third waves are the longest in duration. Repeating the process for a single circle bisected with the top half-circle rotated as displayed in Figure 3, you get the standard Elliott three-wave corrective pattern. Putting them together gives a Fibonacci count of eight waves in the classic Elliott wave figure.
Starting from an inflection point in a data series, the bisecting line is created by applying a linear regression line (least-squared fit) to data. The original data’s differential from this line is the new data acted upon in the calculations. By measuring the maximum and minimum of this differential data, you have obtained the equivalent of a circle’s boundaries and hence can compute the diameter. Half of this diameter is the radius. When this differential data penetrates through this radius number from a maximum amplitude crossing the plane, a wave is established. This radius number is referred to as the radius filter. If we use the value of pi (3.14159) instead of the radius in the calculation, we have created the pi filter.
The idealized Elliott wave originates from the idealized sine wave from the idealized geometric sphere: the circle. Because of market action, perfect circles will seldom be represented in the data. External factors will cause shape distortions. Most often, we will be dealing with ellipses of varying compressions and shapes depending on internal market dynamics. The angles of the linear regression lines will determine levels of corrections. Because the basic method will usually reveal two underlying circles or ellipses in the trend direction, and one circle or ellipse as corrective, you begin to understand why so many corrections halt at a 50% retracement level.
Differences between impulse and corrective angles intimate different corrective levels. A sharper angle of correction would suggest a deeper correction is in progress — perhaps to the Fibonacci 0.618 level. A smaller correction angle would indicate a shallow correction to the 0.382 area or less.
Spherical Wave Filters
Because this method is derived from cumulative values and does not calculate from inflection points, the only way to ensure accuracy would be to use tick data, as impractical as that is. Because of this, when wave-finding indicators suggest a wave count different from that of spherical filters, you should exercise caution. Sometimes as the market inputs more and more data into the mix, previous waves will disappear. This is because underlying the impulse waves are two circles, and exogenous events can cause one of the circles to be enlarged or distorted relative to the other. So you should always compare your results to other wave-finding methods and indicators.
Although the spherical filter method seems simple, the market behavior characteristics revealed can provide significant information. This method is dynamic because the linear regression line is constantly changing as more and more market data is input. As markets progress, an Elliott pattern, either impulse or corrective, can suddenly disappear when the market establishes a data point, which becomes a new extreme point relative to the linear regression line. This changes the values of the corresponding spherical filters.
When a trend extends or a pattern completes and a new opposite wave is about to be completed, think of it as a wave of a higher degree that needs a higher-degree circle. In addition, when market actions develop patterns at an extreme variance with a normative underlying circle, the starting base inflection point will be at some distance from the dissecting line. In fact, parabolic moves can decouple conjoined circles, which may abort previous wave counts. This tool is a warning sign of a change in market character. These are all important indications of future market action, and more investigation into early waveforms, wave changes, and their disappearance will surely reveal insights. Spherical waves are not self-referential methods and so are usually effective with periodic data as long as the data is obtained consistently. Spherical filtering will help traditional Elliott analysis by identifying waves early from short data streams, and it is particularly valuable in revealing complex corrections.
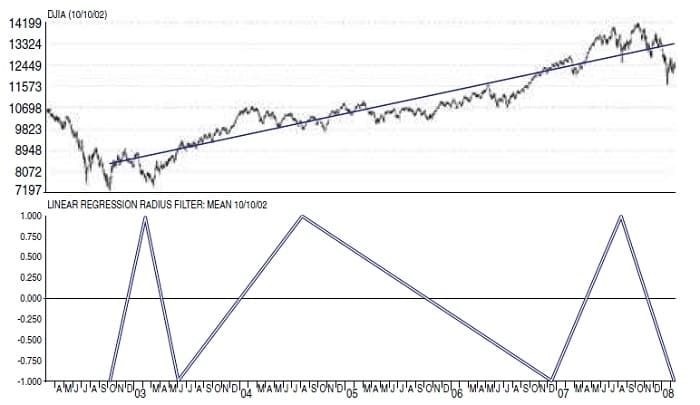
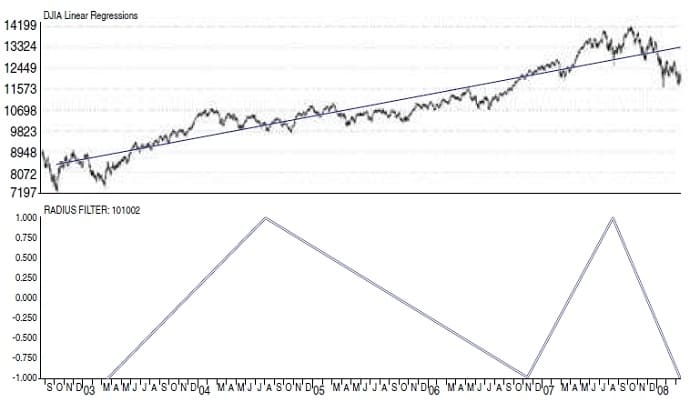
The radius filter chart shown in Figure 4 with data up to the January 2008 lows exhibits a sequence of five waves up from the October 2002 low to the October 2007 high, with a following downward sixth wave. Superficially, it would appear that the top is in. However, although the method registered a straight five-wave sequence up when it hit its high in October 2007, Figure 5 shows what occurred when a couple months’ activity was added. You will note that now there are four waves. Does this mean a new fifth wave will occur? Subsequent market action established that the sequence was completed in October 2007.
It should be clear by now that sine waves originating in the geometric form of the circle are probably the source of Elliott waves. It should also be clear that the simplest and final reduction of a dynamic process involving numbers has to be two plus one: three circles, two advance/impulsive, and one decline/corrective. These circles will always display linearly in sine waves, which will exhibit five waves impulsively and three correctively when acting dynamically.
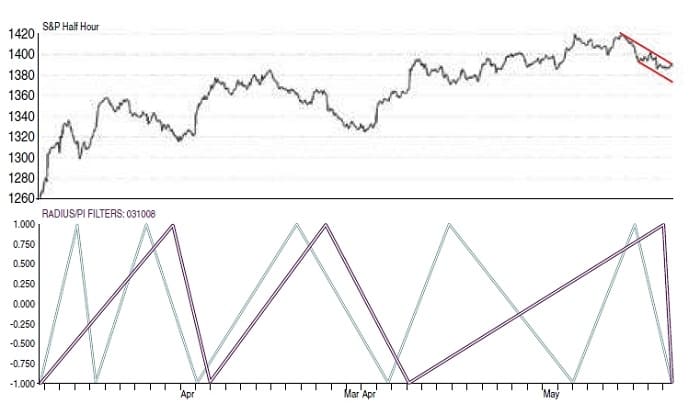
Figure 6 is a chart of Standard & Poor’s 500 half-hour data from the March 2008 low to early May 2008. The purple waves are the radius filter. The aqua waves are the result of using a pi filter. Note that the count is five waves up to that point for the radius filter, but nine waves up for the pi filter. I find using the pi filter with the radius filter to be helpful, but I’ll let you decide what is best for you. There is still more work to be done on using spherical filters, which I believe will reveal additional insights into the origination and development of waves. I suspect that there are many surprises awaiting us.
Richard Johnson is a former stock broker who has been trading for 30 years. His interest in financial markets has led him to create dozens of indicators within specific methodologies while exploring the ramifications of theory.