Trading Articles
Sidestepping Risk In Gold Futures By Anthony Trongone
Want to trade the gold market but reduce your exposure to its sharp downturns? The brightest trading commodity is still the yellow metal. With its uncanny ability to achieve historic pricing records, gold’s demand remains strong. After decades of selling, central banks, most notably in Asia, are diversifying their foreign reserves by purchasing millions of tons of gold once more. If the fundamentals driving this investment remain attractive, the prospect of rising prices would increase; nevertheless, despite waves of explosive buying, many investors seem to be reluctant to take a position in the precious metal because they do not want to get caught in one of its unpredictable and ruinous meltdowns.
Can you buy gold but still remain relatively risk-free? This article is for those market participants who want to do it all, who want to trade the gold futures contract (GC) but reduce their exposure to one of its painful downturns. How often do these corrections occur? Despite this contract’s uplifting performance going back 513 trading days, the probability of experiencing a loss of $10 or more per contract in a single day was about three in every 13 trading days. Not having a position at all when there is a $10-plus correction is best, but that’s not realistic. A more attainable objective is to gain a better understanding of what causes these steep losses.
SETTING THE STAGE
Let’s examine the impact that a $10-plus daily loss has on the trading days immediately after a large loss. With a 100 multiplier, a $20 loss would result in a $2,000 setback for each contract. This study begins after the $17.40 decline on March 4, 2008, and runs until March 17, 2010. During these 513 trading days, the continuous GC contract, which uses the nearby expiration date, had an increase of $157.90. (The historical daily pricing for this continuous contract [GC #F] comes from downloading the numbers at esignal.com.)
As of March 4, 2008, the GC contract stood at $966.30. Since then, it had a brief run to $1,000 but sank to $681 (October 24, 2008). A few weeks after the equities market began its bullish run, this contract took the spotlight as the price of the yellow metal made its way to an intraday price of $1,227.50 (December 3, 2009), finally sliding to a closing price of $1,124.20 on the last day of this study.
READING FREQUENCY CLUES
The frequency chart in Figure 1 shows the distribution of these 517 trading days. This double-axis chart displays two variables. The downward vertical lines represent the 117 single-day losses (starting at a $10 decline), whereas the price of this continuous contract is on the right side of the chart. A glance at the percentages reveals that this contract exposes the market participant to roughly three corrections in every 13 trading-day period, but this is misleading because the spacing between corrections does not occur at regular intervals.
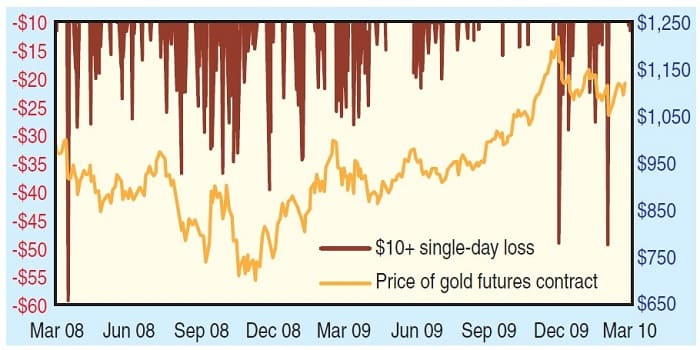
The column chart displaying these downward spikes shows a pattern of uneven volatility. These $10-plus retracements appear to occur in bunches, but there were also stretches of stability, creating a more productive trading environment. The earlier part of the study has the largest percentage of meltdowns. After the bearish run in March 2009, the frequency and severity of these downturns diminished. Investigating the smaller patches of downside activity can improve our trading; although this information is meaningful, it does not create a profitable strategy in itself.
Suggested Books and Courses About Commodity and Futures
ANALYZING THE NUMBERS
Does a single-day meltdown in the price of gold produce a bearish market environment, or does it merely present a buying opportunity? The column chart in Figure 2 shows the results of taking a long position after a loss of $10 or more in the GC contract. Note that although there were 118 corrections, in evaluating the day after a correction, we had 117 setbacks. Once this contract had a single-day $10-plus decline, another one was likely to occur.
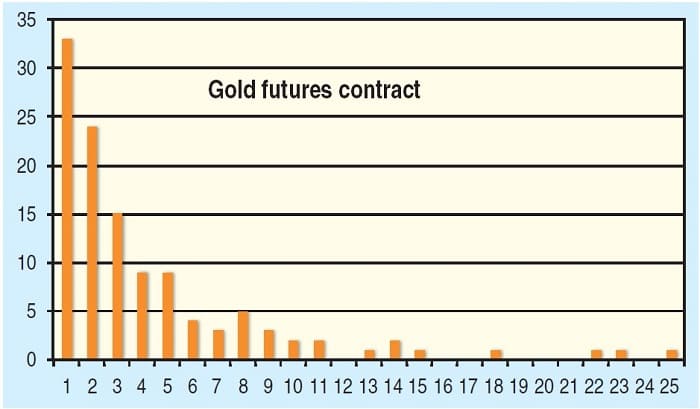
The column chart shows the number of days it took before another correction. For instance, on the very next day (with a $10-plus decline on two consecutive trading days), there were 33 repeat performances. The probability of another $10-plus loss two days after a correction was 20.5%. Within three days (that is, one, two, or three days after a $10-plus loss), we can anticipate another correction in 72 of these 117 setbacks; broken down, it came to eight of 13 corrections, which was, notably, at 61.5% — close to a Fibonacci number. The performance table (blue insert) displayed in Figure 3 shows the actual results of the days it took before another setback. After a $10-plus loss, it had a winning (60–58) record.
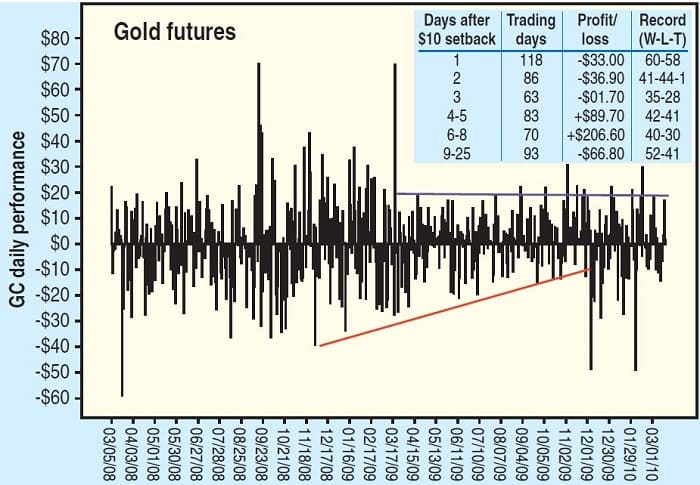
After two days, the possibility of incurring another acute loss appeared to diminish. The next day saw a $33 cumulative loss after a $10 slide. The day after that, the results were slightly more negative. If these results held, the trading environment would begin to improve three days later. In spite of the minor loss, this bracket had a favorable (35–28) winning percentage. The two positive performance brackets came on the fourth day after the correction. The best results — a profit of $206.60 in 70 trading days — occurred between six and eight days after a $10-plus loss. The final bracket, with roughly a fifth of the trading days, was deceiving. Despite a $66.80 deficit, it was able to produce a winning percentage of 52–41.
Why was there a discrepancy between its dollar performance and its winning percentage? In the absence of downward turbulence, some commodity traders could become more complacent with their long positions, whereas others are willing to take on more risk by adding to their positions. However, once gold prices begin falling, those investors with an excess of long positions are less likely to take a wait-and-see attitude. They respond to the fear of loss by flooding the market with sell orders.
When there is a long respite after a correction, trading the next losing day appears likely to be a day of extremes. In the 41 unprofitable days, eight had a loss greater than $20; the largest single-day contributor to this bracket was a $59 meltdown. To prevent such a crippling loss from fatally depleting your trading account, I can suggest two safeguards: Take a smaller position, or use a stop-loss order, which would keep you in the game unless the price of gold falters. Either way, if your long position deteriorates, it will be a more bearable loss.
BY-PRODUCTS OF GOLD
Chasing after rising gold prices can be profitable, but rushing into a long contract when there is the prospect of a $10-plus correction in three of every 13 trading days can inflict long-lasting damage to your portfolio. Another option is to take a position in a by-product of this contract. For those investors not willing to take on the risk of a 100 multiplier, there are reasonable replacements. Many investors use the SPDR Gold Shares (GLD), the most popular exchange traded product specializing in this metal. However, there sometimes is a divergence in price between these two instruments, especially on those days where there is a strong retracement. In this study, the correlation between the two instruments was r = 0.83; however, a comparison between the average loss is a better indicator.
In the 117 meltdowns, the average decline of the GC futures contract was $19.19, whereas the SPDR Gold Shares would set you back $1.67. In order to generate a perfect hedge, it would require 1,149 shares ($19.19/$1.67) of GLD to offset one GC contract. This commodity is often seen as a good diversification strategy — that is, a long position in the yellow metal will mitigate some of the risk you encounter on those days when the equities market suffers a hefty loss.
Although gold is virtually indestructible, from February 19, 2009, to April 28, 2010, neither GC nor GLD was consistently good at hedging against an unprofitable day. For instance, during these 300 trading days, the SPDR (SPY), with an average daily trading volume of 222 million shares, is probably the best indicator of the equities market and had 50 days with a decline of 1% or more. Nevertheless, in these 50 days the futures (GC) contract fell in sympathy with the SPDR in 34 of the 50 days, declining $294. As a hedging instrument, the GC was less effective, declining in 40 of those days with a loss of $33.54.
THE TAKEAWAY
After a brutal pullback, nobody wants to get caught in another avalanche of sell orders; active daytraders are more likely to left-click on the ask (selling) side of their trading screen as soon as this commodity begins to tank. On the other hand, when it starts to show signs of recovery, daytraders instinctively react by jumping in so they will not be left sitting on the sidelines.
This article was written for those market participants who want to begin trading the GC futures contract but do not want to participate in a day in which the contract suffers an extensive loss. Most technicians try to reduce the risk of taking a single-day beating by attempting to forecast price movements; however, the basis of this article is not about observing price patterns, but reacting to the probability of encountering a large setback on any given day.
Since these setbacks do not occur in a systematic pattern, we cannot accept the statistical assumption of independence. By knowing the history of these downturns, we can be more effective at putting the percentages on our side. Consequently, we are looking to take a long position when the chances of a correction are less likely, but we refrain from holding a long position in this futures contract or a by-product of this precious metal when the chances of large loss is more acute.
For instance, the probability of a single-day $10-plus downturn on the day after a correction was roughly two days after every seven corrections. After waiting six days, however, the probability of encountering another correction fell to one in every five days. This leaves us with a significantly smaller percentage of these downturns. If after six days you begin trading either the GC contract or a by-product of this commodity, surely a tactical escape route is necessary. In any event, enhancing your knowledge of how an instrument reacts after a correction will inspire more confidence in your ability to sidestep these nasty downturns.
Anthony Trongone, CTA, has taught overseas e-MBA courses to 1,200 graduate students. He is the author of Quantitative Methods For Finance And Investing (Cengage Learning, 2008). In addition, his book is Trading In The Footsteps Of Sherlock Holmes. As a Master Educator for e-Signal, he regularly writes articles on investment strategies.