Trading Articles
Gann Ratio Timing and Square-Out Techniques Explained
The Idea of ‘time & price’ squared or equal, assumes a perfect balance. This is what you would have when a stock’s price is resting on a trendline provided that the trendline is a true 45 degree slope or a one unit of time and one unit of price. When the stock touches such a trendline the time duration is exactly equal to the price changes so the balance is perfect and we then see the stock either bounce off the trendline (a kind of change in trend acceleration of existing trend) or it breaks thru the trendline and a reversal trend is started.
Since stocks bounce off trendlines all the time but don’t reverse the market there must be something else at work to create the ONE time the stock hits the trendline and breaks thru it. If you have understood the prior paragraphs up to now you will instantly know the solution. Since the 45 degree trendline is a ‘1 to 1’ relationship, which means that a stock with a $30 low will have a trendline at 31 one day later and 37 seven days later. If the stock touches the trendline now it will not reverse because it needs to square the ‘full’ low of $30, so it must touch the trendline 30 days later when the ‘final’ low is squared to the time of 30 days or time units. This is a full ‘Square the Low’ event but if the recent past high was $50 going down to $30 for the low, then we could ‘Square the Range‘ (i.e.20) when our up trendline from $30 crosses the $50 price. Note that this is a ‘timing line’ and not really a trendline (it could be but usually isn’t).
A timing line just goes up keeping track of time in an exact proportion like 1 to 1 or 2 to 1 or 4 to 1 or even a Fibonacci ratio like 1.618 to 1. When these timing lines square a high, low, or range, you can still get tradable turns in the market but usually the final highs and lows to start and end major bull and bear moves are 1 to 1 angles on some time frame. Most traders use one point per calendar day or one point per trading bar and these usually work but the big breakpoints in patterns often form near Fibonacci ratios like .382 or .618, or 1.618.
These timing angles going up from lows or down from highs will intersect the current price level at Fibonacci relationships and often give bigger turns in the short run but don’t always change the major trend. Many times its easier with a chart to just draw a straight line that keeps going as a timing line rather than zig zag up and down and perhaps lose some accuracy each time you tum the angle 45 degrees. The alternative is to draw a continuous line and look for doubling levels in price so a $50 stock will see a turn when a timing line reaches $100 or $150, or $200 just as it would if it went from $50 to ‘zero’ then back to $50, then back to zero.
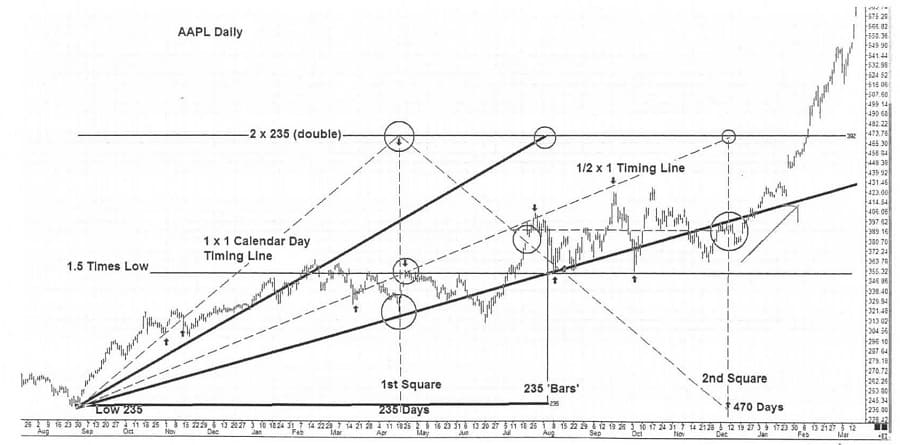
This daily chart of Apple shows a one point per calendar day timing line from a low of $235 and a lower 1/2 point per day timing line. Early in the advance the timing line became a trendline as the stock touched and bounced off and then broke thru this angle. In both cases the main long term up trend did not change from up to down. At the timing line ‘double’ or square out of 235 days from a $235 price there was a low in the market but the price was not ON the primary 1 x 1 trendline so a major change from the origin point trend was not seen, but the 1/2 harmonic line touched the price very near that exact date and hit the 1.5 price resistance level from the low, causing a two month decline but not a major bear market. Likewise on the way down from the theoretical double top line (zig zag timing line) the price gaped thru and then bounced off the angle but the long term trend did not change.
Even the intersection of the $235 low for the 2nd square just gave another reiteration of the long term uptrend. These types of harmonic timing turns can give great trades but rarely change the market from a bull to a bear long term trend. Note the intersection of the 1 x 1 and 1/2 x 1 angles gave rise to a horizontal support and resistance line (dotted). It is important to note that THIS intersection is not just 1/2 of the price range since the intersection came with the 1 x 1 angle coming down from the theoretical double price.
Advanced Books and Courses on W.D. Gann Methods


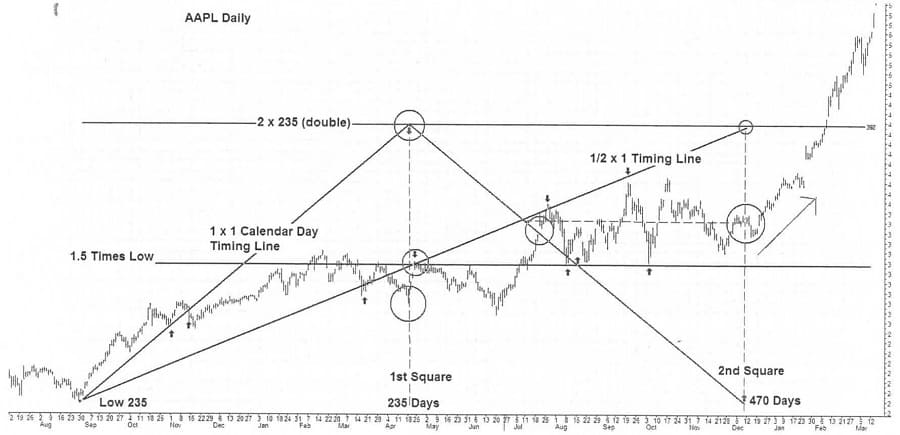
The intersection nevertheless was a good support and resistance level and created a ‘harmonic node’ which we will deal with at length shortly. In many of these timing line price hits, we are dealing with ratio or proportion square outs of a fractional harmonic of time and price like 2 units of time and one of price or 1/2 of price and 1 of time, or even less obvious ones caused by the intersections of the various timing angles at various nodal points. Before we leave Apple let’s look at one more alternative and that is the one unit of price to one ‘bar’ of time. The Bar angles are the heavy lines with the former calendar day angles now appearing as ‘dotted’ lines.
Now we can see slopes that more closely follow the pattern of the stock’s price and the’ big culmination run and break occurred right at the 235 bar count double in time and the 1/2 by 1 bar angle caught the decline perfectly. Following up the 1/2 by 1 bar count angle to its top at the 2 x 235 line will result in the next major tum in July 2012. Both calendar days AND trading bars seem to work and give us turns but what is the single best one to use?
This goes to the heart of W.D. Gann’s methods and I only reveal them in my personal seminars but know that they are astrological based time counts and various planets as well as pairings that move at variable speeds. The reason he was so perfect in his predictions, however, is that from the date of birth of the stock it could be determined for once and for all time what time factor would be used and what kinds of angles would result in bull and bear markets. That is far too advanced for a book available to the public but as we develop these types of ideas further we will see that we really don’t need the astro to make lots of money in the market and many numerological angles can be extremely precise down to the minute every day if we apply the correct method. The lesson here is that timing lines will tum the market or stocks at full and fractional price levels of the origin, and the full square outs are usually the bigger turns and chances for major long term reversals.