Trading Articles
Market Timing with Gann Time Counts and Cycle Ratios
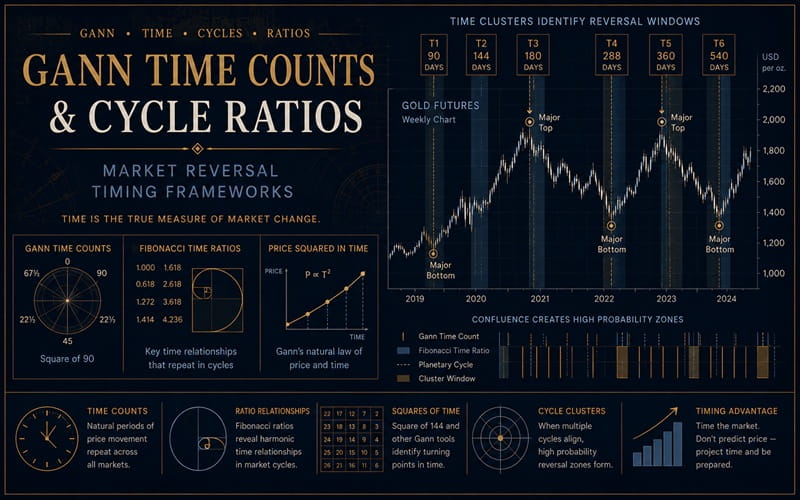
Time is the most important factor in forecasting market movements. The future is a repetition of the past and each market movement is working out TIME in relation to some previous Time Cycle. W.D. Gann. Time is: the most important dimension in market analysis, yet it is the most ignored factor. The best most traders and analysts can come up with in timing the market is to look for so called cycles of fixed length periodicity. This is a simplistic view of market movements that does not reflect market activity at all. The key to market timing is found in the above statement by Gann, “Each market movement is working out TIME in relation (proportion) to some previous Time Cycle.” Gann described three primary methods to determine time periods when change could be expected in market activity.
- TIME COUNTS. Equal divisions or proportions such as eighths and thirds of a fixed period such as 360 or 144. The 360 represents the 360 degrees of a circle and 144 is 12 squared and a very important time and price number in the market. Time or price divisions of 144 are referred to as the Square of 144. The divisions of 360 are referred to as the Square of 90. These cycle lengths are called static symmetly. They are static because they are fixed and repetitious. They are important time divisions in any market but are secondary to the more important ratios of actual previous market activity.
- PRICE SQUARED IN TIME. A proportion of the price range or the extreme high or low of a completed cycle will often indicate the subsequent time movement of market activity.
- TIME CYC LE RATIO. A proportion of a previous time cycle will often indicate subsequent trend reversals.
These two time divisions are called dynamic symmetry. They are not of any fixed period. The length of these proportions will be different for every completed cycle as they are determined as a proportion of an actual cycle. These are the primary timing indicators as they represent and reflect an actual growing and evolving market. If a trader calculates all the time counts, price square time and time cycle ratios for every major and minor cycle in a market, you will have so many time periods that the market will inevitably reverse at one of them. Your best signals come when there is a group or cluster of a number of time periods that come due within a narrow time zone of two or three days. When two or more time periods that are calculated by different methods coincide, there is a strong possibility for a change in trend to result.
Advanced Books and Courses on Market Cycles & Timings


I have developed several different forms that organize all the time data for any one market. I recently reviewed the time cycles and data from the December 14, 1987 top in gold to the present. Just for that 16 month period I have completed 44 pages and literally hundreds of time calculations on my timing forms. But that work resulted in accurately projecting all the important trend reversals in the market up to including the recent February 17 low. These trend reversals were projected weeks and months in advance. In fact, my previous article for G&EW magazine I projected the December top in gold within one trading day and the exact week of the February low. Later in my newsletter, I made a narrower time period for the February low to February 15-17 at a price of $381 – $386 (April contract). The low came on February 17 at $381. These projections were in print literally weeks in advance. Let’s take a look at some of the counts and ratios that resulted in price clusters that indicated a trend reversal was likely in these projected time periods.
CD = CALENDAR DAYS
TD = TRADING DAYS
12/6:61.8%x 115=71;71CD+9/26= 12/6
6/3H – 9/26L + 11 5CD 12/5:33%x210=70;70CD+9/26= 12/5
2/29L – 9/26L = 21 OCD 12/7:2 x 94 = 188; 188CD + 6/3 = 12/7
2/29L – 6/3H = 94CD 12/7: 72CD (1/2 Square of 144) + 9/26 = 12/7 12/2: 75% x 89.5 = 67; 67CD + 9/26 = 12/2
$89.5 = range of the 6/3H – 9/26L
In the issue of November 8 of my newsletter, I projected December 5-6 to be an important time period to be alert for change in market activity. Gold made an important top one trading day earlier on December 2, while platinum topped precisely on December 5.
2/17: 144CD + 9/26L
1.25 x 115 = 144
115CD = 6/3H – 9/26L 2/18: 1.618 x 89.5 = 145; 145CD + 9/26L 2/16: 1.5 x 172 = 258; 258CD + 6/3 = 2/16, 172CD = 12/14/87h – 6/3/88H
2/15: 1.382 x 37 = 51; 51TD + 12/2H = 2/15
$37 = range of 9/26L – 12/2H
2/14:2×37+74;74CD+ 12/2=2/14
In December, I had projected that the intermediate term trend was likely to reverse the week beginning February 13 and that February 15-17 was likely to be the period for the change to occur. An important low was made on February 17. Similar time clusters projected the February 29 low, the June 2 high and the September 29 low or every other major top and bottom since the December 1987 high. Let’s put this timing analysis to the test and once again prepare in advance for possible future market activity. The next time period to be particularly alert for change in the price activity falls in the time zone of May 5-8 (Friday and Monday).
5/8: 50% x 1022 = 511; 51 ICD + 12/14/87H = 5/8
1022CD = 2/25/85L – 12/14/87H
5/8: 2.5 x 89.5 + 224; 224 CD + 9/26 = 5/8
$89.5 = range 6/3H-9/26L
5/6: 2/29L = 432CD (3 x 144 = 432)
5/5: 77CD = 2/17L
77CD = 12/2H – 2/17L
5/5: 3.382 x 89 = 301; 301CD + 2/29/88L = 5/5
$89 = 12/87H – 2/29/88L; 89 = Fibonacci #5/5: 48 weeks + 6/3H; 48 = 1/3 x 144
Be alert for indications of trend change within one trading day of May 5 or 8. While time is the most important dimension in the business of speculation, we must be prepared for the price and pattern activity as well. There is very important price support at the $374-$378 price zone basis the June gold contract. Should price move into this price zone in the May 5-8 time period a very important longer term low and reversal is likely to unfold. This article is submitted the week of April 24. By the time you read this, we will see how helpful this timing projection would have been to someone prepared in advance for important minor and major time and price reversals. It will be well worth your time and energy to calculate all the time counts, divisions and proportions for every cycle in every market that you are interested in trading, It is a great deal of work, but can result in a great deal of profit. I’m sure you will find the effort as profitable as I have.