Trading Articles
Projecting Price And Time With Gann Fans And Angles By Koos van der Merwe

Is it new? No, but Gann theory can still be implemented in the modern financial markets. According to W.D. Gann, past time and price cycles will influence future price and time cycles and tell us the time and price at which future cycles are most likely to terminate. This theory sounds complicated, but it led the famous trader to the Gann fan, the angle of which could be used to project future price and time terminations. Here’s how.
GEOMETRIC ANGLES
Geometric angles are used to measure the relationship between time, price, and space. The angles divide price and time into proportional parts. Gann angle lines are drawn from specific important points on any of the short-, medium-, or long-term charts. They are drawn at a specific angle that represents the relationship of time and price. In effect, the geometric angle is a moving average line that moves up and down a chart at a uniform rate of change. The difference between a standard moving average and a Gann geometric angle is that Gann angle lines may be used to project future time/price relationships.
W.D. Gann’s ratio angle lines represent the momentum or rate of change in price activity over time. The steeper the angle, the stronger the price momentum will be and the more powerful the advance or decline. Therefore, all of Gann’s techniques are used to project future time and price relationships. His methods prepare the trader and investor for likely market activity. A 1×1 angle line may be drawn from any important cycle bottom, and moves up (or down) at the rate of one unit of price per one unit of time. When a price trades at the 1×1 line, the price and time has squared or balanced.
DERIVING THE GEOMETRIC ANGLES
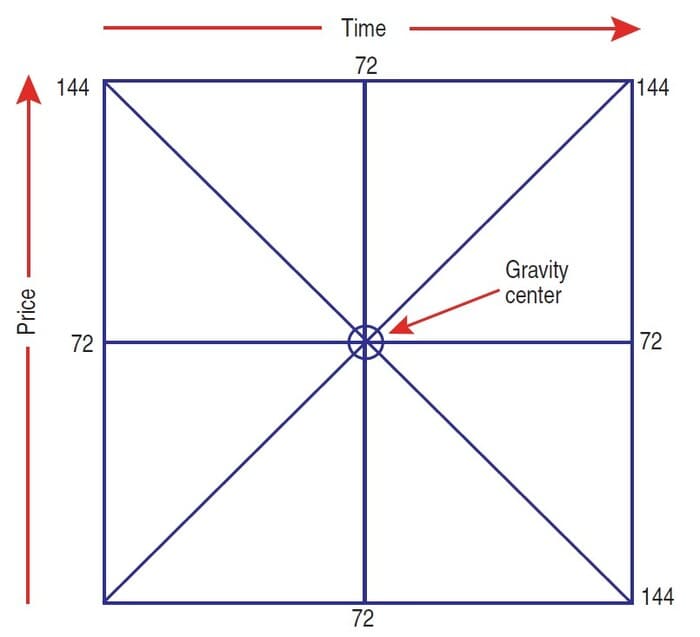
There are three types of angles: the vertical (90 degrees), the horizontal (zero degrees), and the diagonal, which can be anything between zero and 90 degrees (Figure 1). Each angle divides the square into two equal parts, which are the strongest and most important points in the square of both time and price.
- Zero degrees at 72 = 50% of the range in price
- 90 degrees at 72 = 50% of the range in time
- Gravity center = Strongest point within the square
DRAWING ANGLES BY COMPUTER
Computer technology makes drawing the angles a simple process. The naming of the angles is shown in Figure 2. The most important angle is the 1×1 or 45-degree angle. This is the diagonal to the square and divides the square into two equilateral triangles. The 1×1 line progresses at the rate of one unit of price per one unit of time. This angle rises at a 45-degree angle and divides time and price equally. Whenever a price touches the 1×1 line, the market has moved an equal amount of units of time and price, and is balanced or squared.
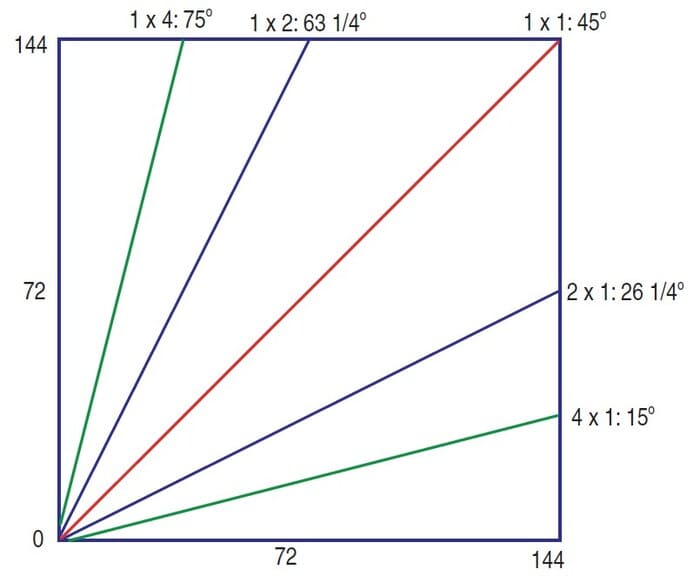
The 1×1 line indicates whether the market is in a strong or weak position. If it is trading above the 1×1 line, then it is trading strongly and prices are likely to move higher. If the market trades below the 1×1 line, it is weak, and lower prices are likely. Gann used the 1×1 line to enter a position with a minimum of exposure to risk. He would buy or sell when prices touched the 1×1 line, placing a stop just a few points on the lower side of the line. The 1×2 or 63 3/4-degree angle moves up at the rate of two units of price to one unit of time. This angle divides the area between the 45-degree angle and the 90-degree angle.
The 1×2 angle is the next strongest angle following the 1×1 angle. A market that trades above the 1×2 angle is in a stronger position than when it was trading at the 1×1 angle. You would never take a short position when the price is trading above the 1×2 angle unless your time, price, and pattern analysis tells you that a reversal of the trend is due. The final move of a bull run will often terminate with a fast move above the 1×2 angle. The reverse is true for a bear market. Whenever a price that is trading above the 1×2 angle breaks below it, it will likely move to the 1×1 angle to find support.
Suggested Books and Courses About Gann Techniques
The 1×4 or 75-degree angle rises at the rate of four units of price per one unit of time. The 1×4 angle equally divides the space/area between the 1×2 angle and the vertical 90-degree angle. Prices trading above the 1×4 line indicate a greater velocity or momentum and a very strong market. They are usually in an explosive rally at the beginning of a new bull campaign, the result of panic buying and short-covering, or in the final blowoff rally at the end of a bull market. The other angles, not shown in Figure 2, are the 1×8 that Gann considered to be the final blowoff of a rally.
ANGLES SUGGESTING A WEAK MARKET
When a price moves below the 1×1 angle the market is weak, and we then look to the angles below the 1×1 for clues about future market activity. The 2×1 angle is the first support in a weak market and is often an important support angle following the initial advance from an important low. The 4×1 and 8×1 (not shown) indicate a weak market possibly weakening into a major bear market, depending on time. The same angles are also drawn from market highs, especially when a market is in a bear trend.
DRAWING THE ANGLES
A Gann fan is always drawn from major highs and lows, which is why Gann’s principle states that you should look at a minimum of 10 years of historical data. With today’s computer technology, you should consolidate data and look for a major low or high, and draw a Gann fan so that the 1×1 angle starts at the low and ends at the high, or vice versa. Since Gann used a protractor to determine his angles, he always used a round number to identify a 1×1 angle. The numbers were 1, 2, 5, 10, and these numbers multiplied or divided by 10. This was for the ease of calculation. Many Gann purists today are still inclined to use those numbers in calculating a Gann fan. In my years of using Gann charts, I have found these numbers are not necessary and use my computer to draw a Gann angle from a low to a high, usually within a rectangle (not always a square). This is because of the ease of drawing with a computer. I use a separate chart and Gann strategy to determine time. I will discuss this in my next article.
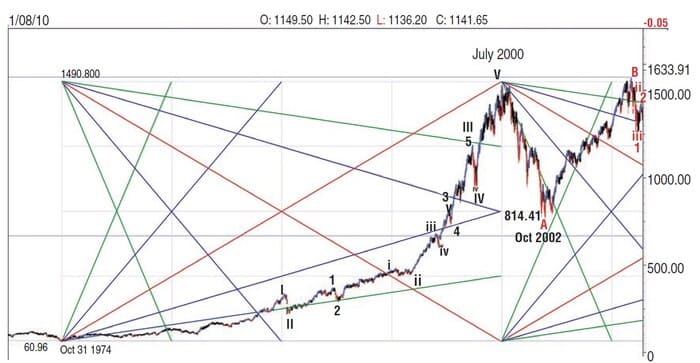
In Figure 3, I have drawn a Gann fan from a major low to a major high so I can identify the angles to use. Note that the 1×1 angle does not create a Gann square. Observe the following:
- The Gann fan was drawn from the low of October 1974 to the high of July 2000. With the Gann angle now determined, all Gann fans can be projected forward.
- The Gann square was in fact traced by the 1×2 line on the chart, not the 1×1 line. The interpretation we are looking for is still there.
- Note how the price started moving up on the 1×4 line, finding no resistance at the 1×2 line but using it as a minor support level before rising strongly to its top.
- Note also where the vertical lines drawn through the gravity centers of the 1×2 and 2×1 angles and the 1×1 angles have identified highs.
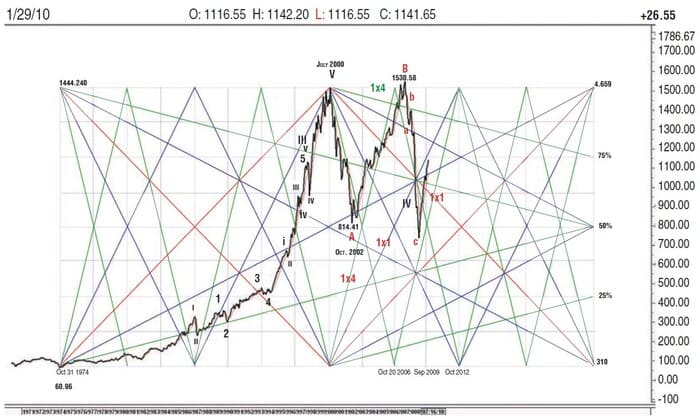
In Figure 4, I have taken the same Gann fan and extended it from the high. I have also increased the angles in the fan so I can see price momentum more easily. Gann also divided a price move into eight equal parts, as shown. He never explained why, but I believe it was because market prices moved in eighths. In today’s market, prices move in tenths, so you should divide the difference between the high and low in 10 equal parts, not the eight as shown on the chart. Note the following in the chart:
- The fall from the July 2000 high closely traced the 4×1 line.
- A bottom formed at the 50% retracement line, close to the gravity center created by the 1×4 and 4×1 angles.
- The index then rose with the 1×2 angle, at first using it as support, then breaking through it, suggesting that weakness is developing. Once the index fell below the 4×1 angle, a bear trend was confirmed.
- Note how once again the index tested the 50% retracement but this time broke through it. It came close to finding support on the 1×1 angle and rose strongly, suggesting the start of a new positive trend.
- The rise appears to be at the same angle as the 1×4 angle, suggesting that a correction could soon occur as momentum starts to weaken.
Do the chart and Gann lines tell us anything about the future? Yes and no. Yes, because it tells us that the upward correction that appears to be following the same trend as the 1×4 angle is too rapid and that a correction will occur, possibly to the 1×1 line. And no, because it tells us that December 2012, the gravity center of the 1×1 angles, is a date you should watch.
PARALLEL ANGLES
To get a more accurate reading, Gann developed parallel angles. Parallel angles are lines drawn parallel to a Gann angle from a swing low or swing high. Figure 5 shows how he achieved this. Going back over history, Gann would establish a fan between a major low and major high as shown in Figure 5. As an example, I am using the chart of Jarden Corp. (Jah).
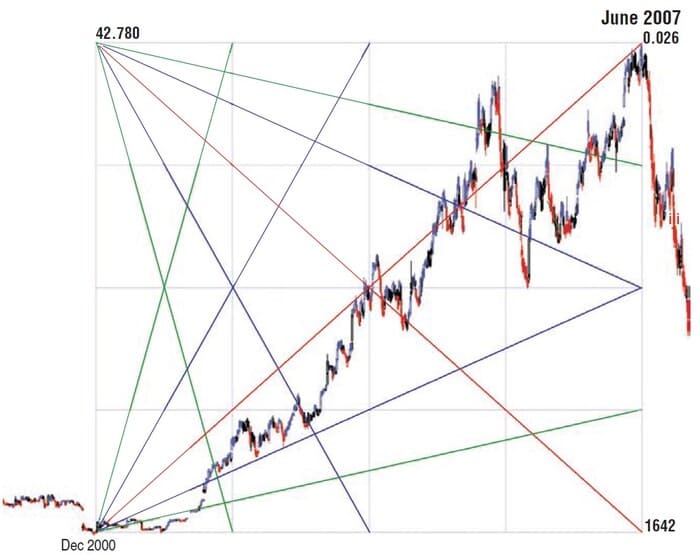
I have drawn a Gann fan from the low of December 2000 to the high of June 2007. In doing so, I have identified the 1×1 angle, the 1×2 angle and the 1×4 angle, as well as the 2×1 angle and the 4×1 angle. I will now look at a daily chart and draw several parallel lines from at least three points to see if I can analyze the trend (Figure 6).
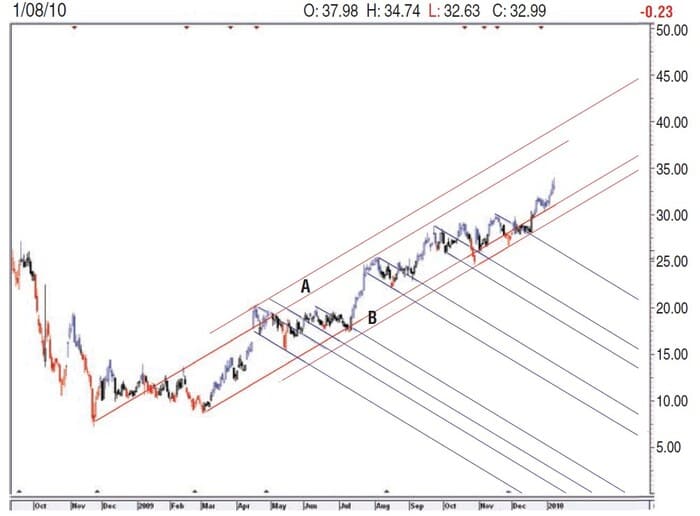
Using the 1×1 angle, I draw parallel lines from major swing points. This identifies buy and sell areas. For example, when the price reaches area A, look for a sell signal once price falls below the up-trending 1×1 angle (lower red line of A). When the price moves into area B, look for a buy when the price breaks above the down-trending 1×1 line (blue). According to Figure 6, Jah is in a buy mode, with a target somewhere in the $37 to $40 range, if not higher. A rising stop will always take us out, should price fall dramatically at any time. If the price falls into the B area, you could consider a new buy.
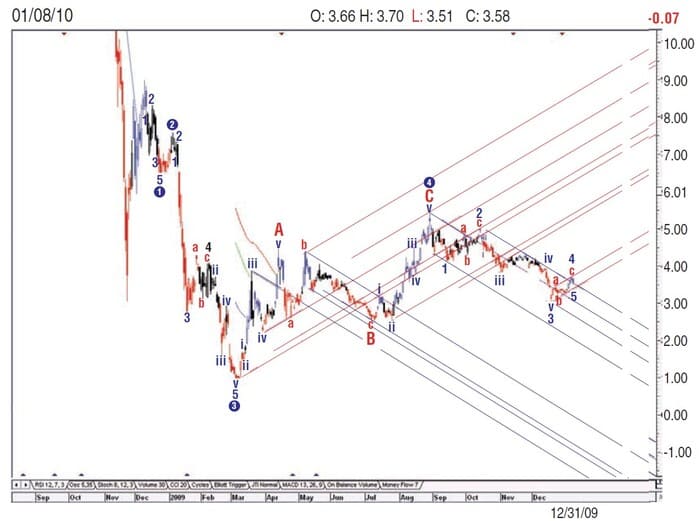
Using the same technique on Citigroup (C) in Figure 7, you can see that the main trend is more negative than positive because the share price keeps establishing new swing lows for the 1×1 up angle and is in overbought areas in the 1×1 downtrend and a 1×1 angle from swing highs. This uncertainty shouts, “Leave me alone!”
WEEKLY AND MONTHLY CHARTS
On weekly or monthly charts, Gann would draw angles starting from the zero price, which was the time of an important low. Because the angle rises at the rate of one unit of price to one unit of time, this 1×1 angle will cross the price level of the low price in an equal number of time units as the amount of the price low. If the price low was $39 and the scale of the chart is $1 per week, the 1×1 line from price zero will cross the $39 price level in 39 weeks. Markets often reverse trend when price and time have squared in this manner. Thus, you do not need to draw an angle from zero on the chart. You can simply count forward the number of time units from an extreme low price to determine when time will square with price.
Koos van der Merwe has been a technician since 1969 and has worked as a futures trader and finally as a technical analyst with a stock brokerage firm in Johannesburg, South Africa.