Trading Articles
Point and Figure Box Sizes By Thomas McGraw

Even after all these years, will point & figure charts tell you when to get in and out of the market? After the early 1970s stock market debacle, I spent years yearning for a simple tool that could tell me when to get in and out of the market. Then one day I wondered if point & figure (PNF) charts would do the trick, using chart reversals as indicators.
I worked with PNF as a momentum indicator, and then exclusively for single stocks in cycles and trends. I used Yahoo! Finance data to manipulate PNF box sizes and record profits from momentum reversals. I found that box size could make a world of difference in charting the data, rather than using a traditional box size of $1 for all stocks priced between $20 and $100. That’s a big price range for just one box size, even for pattern recognition purposes.
Using PNF box (or block) sizes, and calculating chart reversal profits for each, I discovered there were “sweet spots” in size that produced good profits from chart reversals. Moreover, these box sizes continued to work for at least a short period over any other size. It occurred to me that stock trends fall outside “fair coin” tosses as written about by John Paulos in his book on mathematical literacy, Innumeracy.
To do the calculations, I can’t imagine not using a spreadsheet. Microsoft Excel includes a programming utility called Visual Basic for Applications (VBA) and is just the ticket for the tasks described. I was able to put VBA’s syntax to work. Having succeeded in backtrading market turns at optimal box sizes, I began to approach 10% gains over blind buy & hold (BAH) results and set about refining trading for longer terms.
Using a group of 20 stocks to trade 200-day periods, I discovered that:
- Smoothness produced by parameters acting upon data is preferable to rapid response.
- Most intuitive data modifications turned out to be wrong. Reoptimizing box size on a daily basis yielded poor results, while weekly optimization with intraweek stops for safety did far better.
- Shaping factors to exit from a falling market and vice versa for a rising one seldom achieved the desired results. Accurate trend indicators are elusive.
I determined that a modifying factor to an ideal box size could be used to affect the optimal box test procedure. Finding a good long-term trend indicator is an accomplishment in and of itself. I began by using a stock’s 50-day moving average subtracted from the daily price and divided it by the 50-day average. Any negative sign was stripped off, while the decimal quotient was applied to alter box sizes. For example, (($20 stock close – $16 trailing 50-day average)/$16 trailing 50-day average) would have yielded a decimal of 0.25, which could be used to affect the optimal-box test procedure. As daily closing price nears whatever average we use, its effect will become smaller.
Suggested Books and Courses About Trading Charts
The calculations are applied to incremental box sizes and, in turn, we see a higher likelihood of a chart reversal with smaller test boxes. Box sizes should never be permitted to be so small as to admit price movements that equal chart noise. At the other extreme, box sizes should seldom be allowed to grow to prohibit charting at all. More trading action will occur closer to the moving average of this type of system and seldom commit to trades at precise market peaks or bottoms (Figure 1).
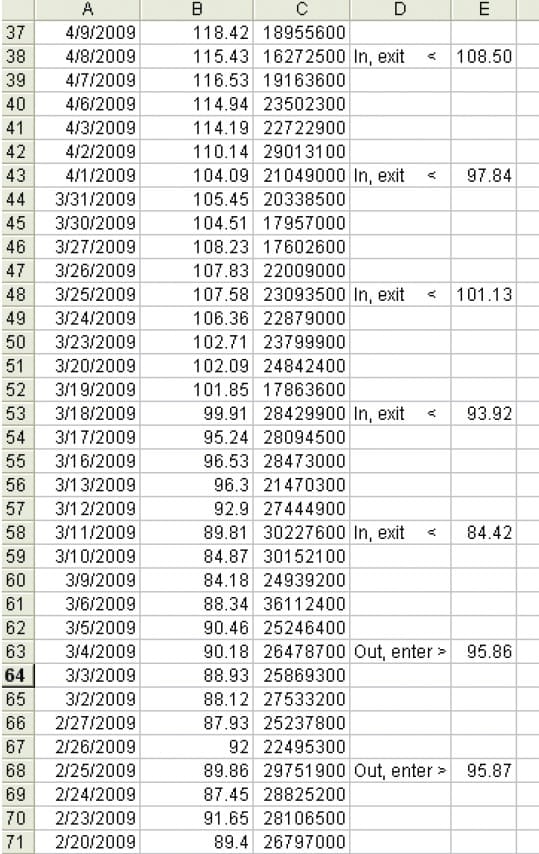
The closing price is displayed in column B and volume in column C. Column D displays the position status and in column E you see the anticipated reversal points. Status and reversal points require weighing Xs (rising box profits) from many charts and box sizes. You can tweak the optimized box size with whatever formula you wish. Obviously we do not know where a real top or bottom lies beforehand, or we wouldn’t need an added system.
THE RESULTS
All screened stocks have produced an average of 16% above basic buy & hold (BAH) commitments in its latest configuration. Backtesting must incorporate round-turn commissions for a true picture and I have used 1% round-turn commissions in summarizing backtested trades. Between July 2008 and June 2009, enhanced point and figure (EPF), for lack of a better name, yielded on average 17% better results than BAH. That market period was wild, and some must have wondered whether to get back into or out of stocks. In fact, many persist in their concerns about continuing volatility in the equities markets in the coming years. One noteworthy bear, Robert Prechter, offers an interesting chart in his Conquer The Crash. SafeHaven.com offers a view of the chart on its website.
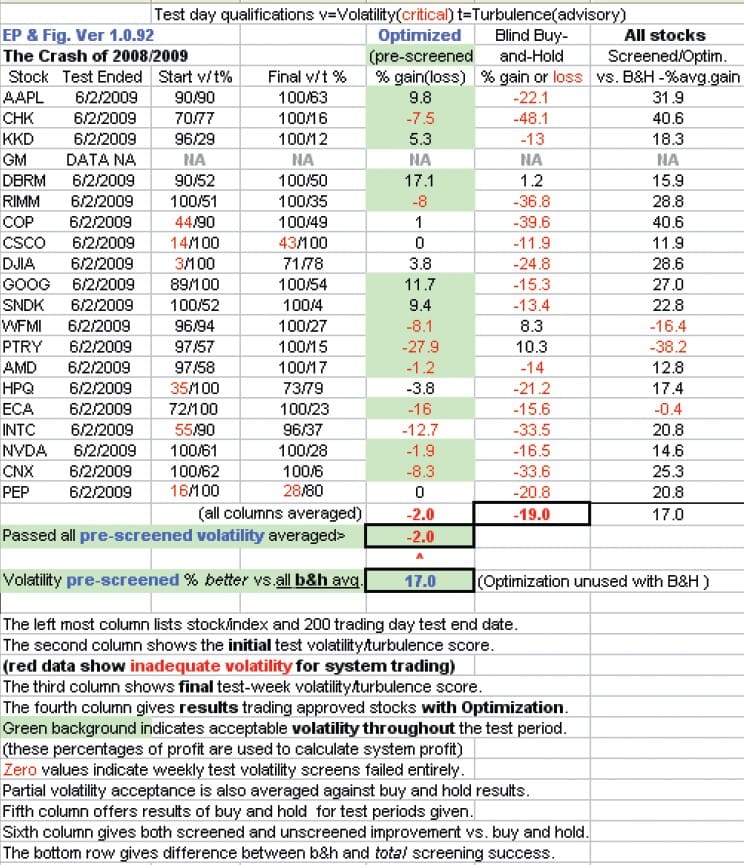
Figure 2 shows results versus BAH. A potential stock must be prescreened for high beta/low turbulence (saw-tooth price patterns). Once you have selected your stocks and started to trade, you need to observe the stocks daily at the preclose of markets for any violation of stops (either up or down) and trade promptly. It is also a good idea to maintain accurate records of all trades.
The system has shown little promise in trading commodities. Using EPF over that period, you would have on average, by June 2009, a -2% loss in backtests of screened stocks as opposed to a comparable “hold & hope” average loss of -19% for all stocks in the database from July 2008. This may not be a panacea, but it may be a promise to trade again.
Thomas McGraw has written for Astronomy magazine and most recently for the History News Network’s “Remembering Past Hard Times.” He has traveled extensively in the US and more than a dozen countries, including China’s New Territories in the 1960s.