Trading Articles
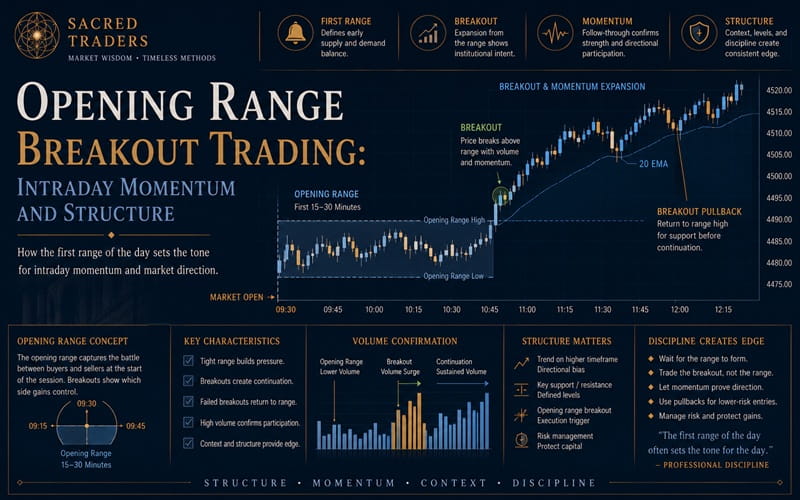
Opening Range Breakout Trading: Intraday Momentum and Structure
I know of some very successful day traders who avoid the first hour altogether. I’ve even heard it referred to it as amateur hour. Perhaps for swing traders and fund managers who hold positions overnight and are trying to avoid being trapped in gap-opening reversals this is true. But for most intraday traders and almost all floor traders, the opposite is actually the case. The 1st Frame is when the professionals trade. In fact, some of the best traders I have ever met focus almost exclusively on the opening time period, and some even leave the market for the rest of the day after the 1st Frame is over. Considering the hours, it’s not a bad life, if you can make it work. With the series of figures and text in this section, I’ll examine some of the methods a day trader working from his video screen can employ to capture the earliest trends of the day.
ORB Defined
In truth, there is no such thing as the Opening Range Bar (ORB). It’s a sort of manufactured item. But there is a thing called the Opening Range. If you’ve ever listened to a squawk box from the S&P pit, you’ll have heard it called out by the pit boss shortly after the NYSE cash opening, just after 9:30 a.m. ET. Orders have piled up overnight and before the actual cash opening so that they can be crossed at a time when there’s enough offsetting volume. It usually takes less than a minute for these orders to be offset, but when they finally are, the price range for this initial auction is pegged as the Opening Range.
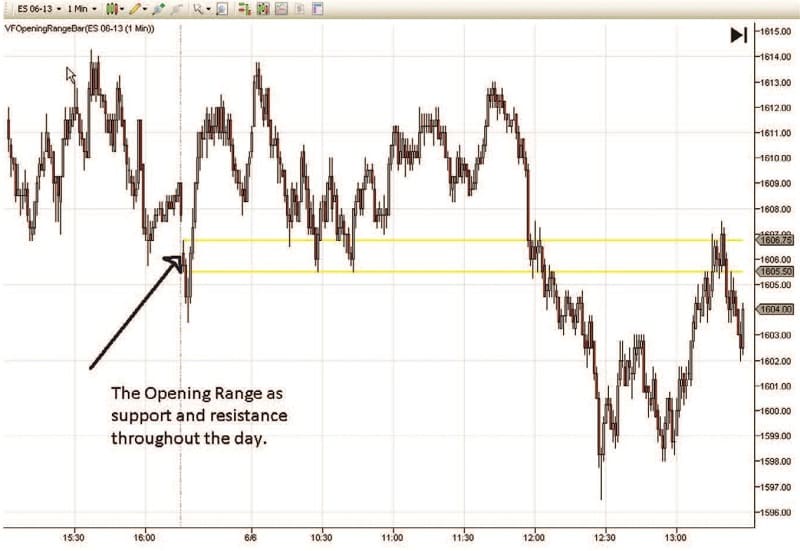
But we trade in the electronic world. The exchanges for the mini-index futures contracts are in computer servers, not open-outcry pits. So we approximate the Opening Range and use the first 1-minute time bar of the day as our Opening Range Bar, or O-R-B. This small range is the first and most important support/resistance number for the entire day. We bracket this range bar and leave the lines of this bracket on our charts for the rest of the day. Stock traders talk in terms of being “green” or “red” on the day in accordance with whether prices are above or below yesterday’s Close, the Y-Close. But for futures traders, prices are said to be down or up from the Open, and the Y-Close is just another support/resistance number to be potentially used as a trade entry or exit point, albeit a fairly important one. (See Figure 2.1.)
Normally, when points of support and resistance are hit by price once or twice during the day, it is wise to remove any line plot associated with their price level from the charts. In fact, most support/resistance numbers are used once, and thrown away. But with the ORB, its relevance to trade entries, exits, Day Models, and overall trend direction remains active throughout the rest of the day. So after drawing lines to bracket the ORB, we leave them up all day—but only to the end of the day—and start again fresh each morning at the Open with a new bracket of line plots.
Not only does the ORB remain a support/resistance zone even after tested by price, but it also seems to regain its power if price vacates the range for a few hours before returning. It’s as if it recuperated in the absence of attention. In later chapters where Midday Frame action is being discussed, more examples of the ORB concept will be demonstrated, especially one called Kilroy’s Castle.
The market can be erratic at its Open, and a departure in one direction or another away from the ORB initially means little as to the trend direction of the day. There are, nonetheless, several trade setups we derive from bar patterns that develop immediately after the opening that usually do produce tradable trends. Whole schools of methodology have evolved around Opening Range Breakouts. Toby Crabel’s Day Trading with Short Term Price Patterns and Opening Range Breakout, was the first to gain notoriety.1 Larry Williams used a similar method of backtesting rule-based patterns and combined the models with day-of-week seasonality as a further filter.2 But I have found both these methods inconsistent, despite the hefty price tag Toby Crabel’s collectors-only book now fetches.
What follows are three ORB price patterns that do produce successful breakouts with a very high degree of consistency. Although none occur more than one or twice a month, I watch for each of them every day. A successful breakout trade usually gets my account well on its way toward a minimum daily profit goal within the first few minutes of trading. And unlike those models of Crabel and Williams fame, these patterns are not derived from daily price bars, and therefore can occur independently of what happened yesterday or the day before. Each day is a fresh opportunity for these to reappear.
3-Bar ORB
The rules for the 3-Bar at the ORB are simple but very precise. This pattern model sets up immediately after the opening, so the rules must be memorized to be quickly recognized before the third minute arrives. Oddly enough, when I teach this pattern to new students, they don’t take to heart the precision of the rules, and often attempt the trade after setup-rule violations.
Using the first three, 1-minute bars of the opening, compare their respective highs and lows. For a bull breakout, each of the successive bars must have a lower low and lower high. If the fourth bar breaks the low of the third bar, the setup is violated. Just reverse this pattern into three higher highs and higher lows for a bear setup. In the leftmost chart of the two displayed in Figure 2.2, from June 6, 2013, note that the directional color and candle pattern of the bars can vary between the three bars without voiding the setup.
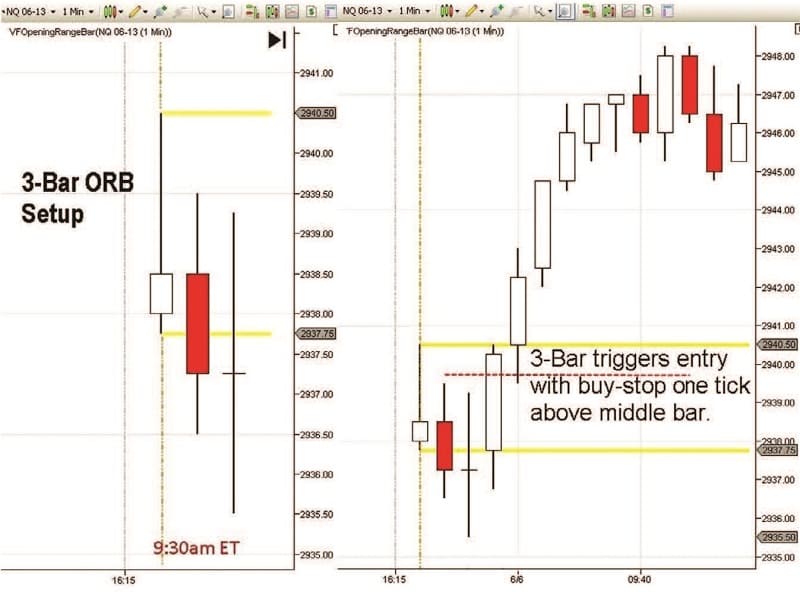
The entry trigger assumes it’s a reversal pattern, and is placed as a buy-stop order one tick beyond the middle of the three down-trending bars, positioning for a potential breakout in the opposite direction to the mini-trend of the three bars themselves. Beginners please note: Once triggered, the success of a trade is one of position management. With a two-unit position, exit one unit quickly, with as little as 0.4 points in the mini Russell contract (symbol TF), 7 points in the mini-Dow (YM), and 1.75 points in the E-mini NASDAQ (NQ). Move the stop-loss on the second unit to an amount of risk comparable to this initial small profit. If the breakout fails, chances are still high that this initial unit exit target will have been filled with enough profit to cover the loss of the surviving unit. A position unit is any fixed number of contracts suitable for a trader’s own risk tolerance. For beginning traders, one unit equals just one contract.
Advanced Books and Courses on Day Trading and Scalping


The pattern works in both directions. For bear trend breakdowns, the bars make successive higher highs and higher lows. Again, the rules are precise. Students typically ignore the precision at their expense. The bars must overlap and be limited to just three in the direction of this miniature trend. Occasionally, the first three bars fall or rise too sharply, one stacked on top of the other without overlapping. This, too, invalidates the setup. Note in Figure 2.3, from May 29, 2013, how the chart on the left was a valid bear setup, but the chart on the right was an invalid bull setup.
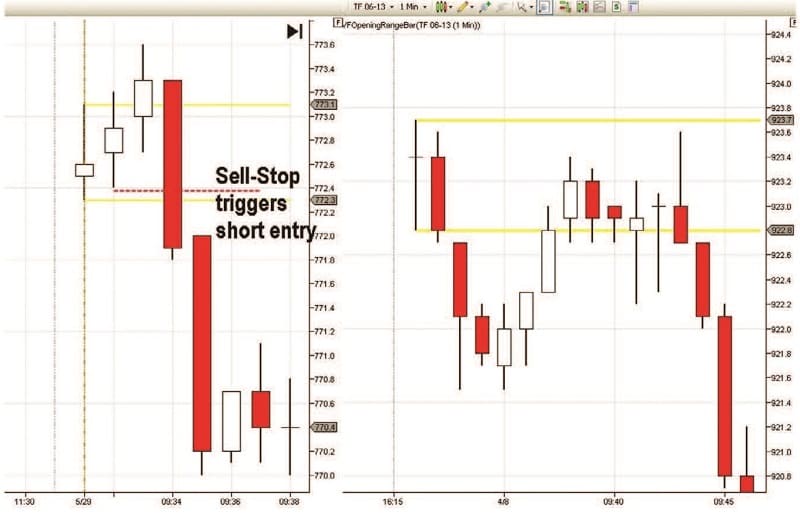
Although this opening pattern can be seen in any contract, I never use it to trade the E-mini S&P (symbol ES). It can work satisfactorily in the mini-Dow (YM), and the E-mini NASDAQ (NQ), but the preferred contract for volatility is the mini Russell (TF). At $100 per point, any successful breakout play can account for nearly half or more of a reasonable five-point goal for the 1st Frame session. See Section Four for further discussion of trade management. More examples are provided on the book’s companion website.
ORB Pennant
The second most successful ORB breakout pattern we have observed at Valhalla Futures is the ORB Pennant. As familiar as a pennant is to most traders, I believe most traders miss this potential breakout pattern for two reasons. First, most intraday traders work in the 5-minute bar frame. I admit preferring a longer view than the smaller 1-minute frame myself, but utilize the less commonly used 3-minute bars for that. But for these early breakout patterns, the 1-minute frame is a must. Secondly, the concept of a pennant must be reduced to its simplest components. As the 3-Bar pattern is actually the gesture of a flag pattern reduced to its most basic parts, the ORB Pennant must be reduced to no more than a mere implication. It’s like looking at a painting devoid of signature and still recognizing it as that of Joan Miró or Pablo Picasso. The smallest characteristic gesture is indicative of the larger identity’s whole. So it is with the power of the market’s opening action. Sometimes, a much larger pattern whole is implicated by the smallest identifying gesture. And the implication in potential trend of this characteristic gesture can be nuclear in outcome.
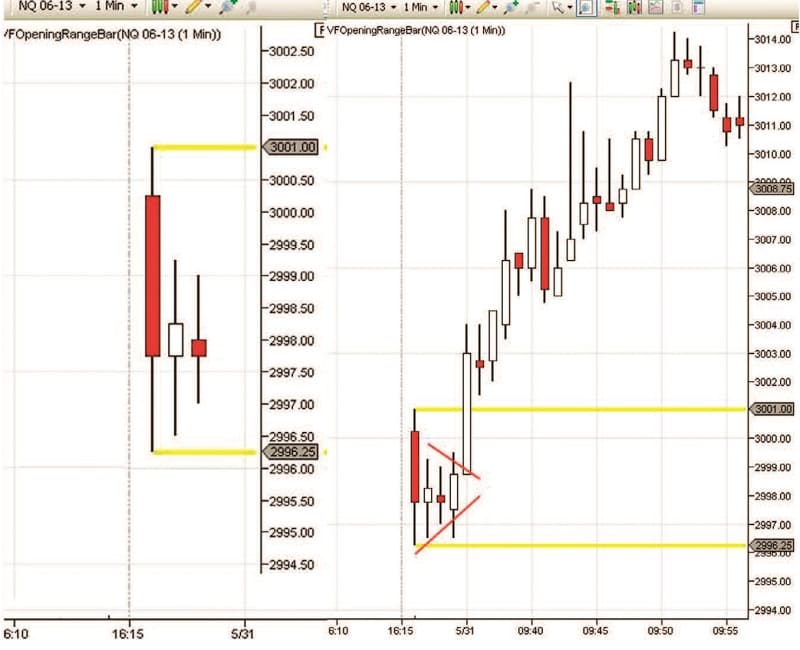
For the ORB Pennant, we look for the first higher low to turn back up and yet fail to make either a higher high or matching high. Instead, it then makes a lower high, and turns yet back inward again. Each of these two turns should be signaled by a change in the candle color to its opposite trend direction, but sometimes a simple Doji indicates the turn back toward the center of the pennant is in place. With the market thus facing two failure attempts at each end to make a new price extreme in either direction, we bracket both the current high and low and enter a pair of trigger positions by means of opposing stop-entry orders, regardless which way the action then goes. Consider that trend has compressed just at the moment where the whole day’s expansion is yet ahead; that price has compressed near the ORB, and is nuclear in implication. By breaking out after such a setup, that initial small compression can lead to a chain reaction, sometimes trending thereafter for the entire day. After that, the trade’s success, like that of the 3-Bar ORB, is a matter of contract management. See Figure 2.4 from May 31, 2013.
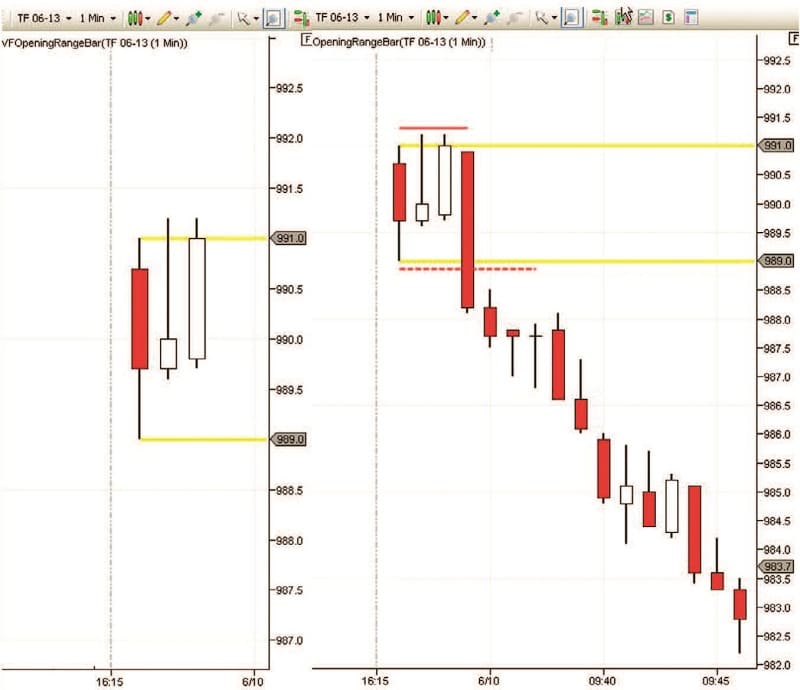
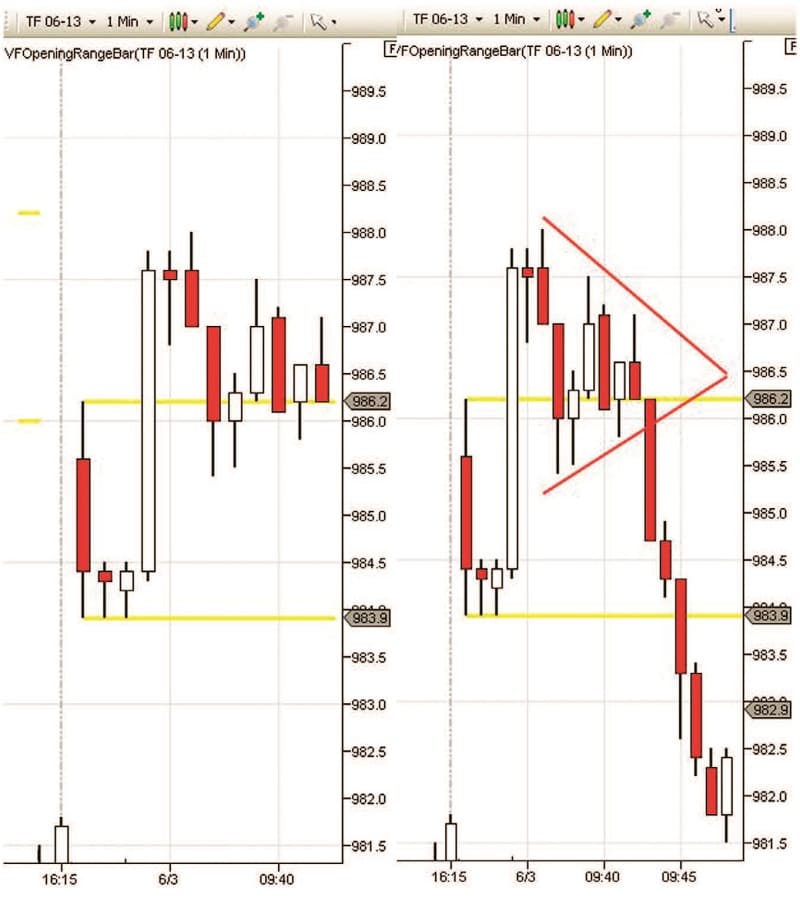
Beginner’s note: Despite the temptation to bracket the trend lines of the pennant with your buy/sell stop orders for a tighter entry price than accomplished by bracketing the high and low of the pennant itself, in most cases, like the one above, it is wisest to bracket your entry orders a tick or two above and below the whole pennant. But when the pennant itself is larger, and is sitting above or below the ORB when it completes, as in Figure 2.5, from June 13, 2013, the bracket can either be entered beyond the high or low of the day, or shifted to just outside the trend lines themselves. The direction of the breakout can often surprise traders. I remember being confident the one in Figure 2.5 was going to break out to the upside.
ORB Matched Highs/Lows
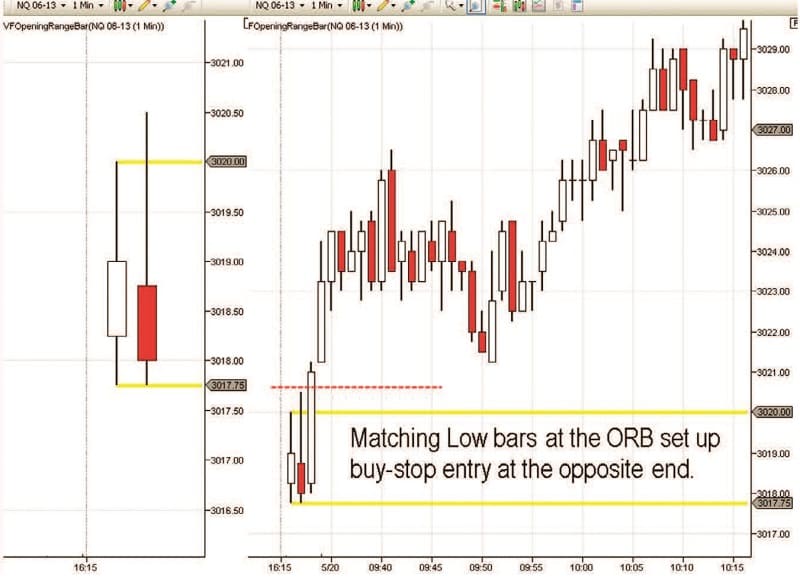
Sometimes price tries but fails to break below or above the initial Opening Range, or a high or low it establishes nearby. If it attempts but fails with at least two, 1-minute bars that have exact matching prices to an initial price extreme at or just beyond the ORB, then chances are good that it will succeed in a breakout out in the opposite direction. Watch for this to set up quickly in the 1-minute time frame, and quickly enter with a stop order at the opposite end of the matching priced bars for a breakout entry to the opposing direction. See Figure 2.6 from May 20, 2013.
This potential pair of matching lows or highs does not have to be the first two 1-minute bars of the day, or be exactly at the Opening Range price limit itself. In fact, it usually isn’t. But this pattern setup should be fairly close to the range limit price, and occur within a few minutes after the actual opening to contain the potential of that nuclear affect contained in the kernel of the ORB, as in Figure 2.7 from June 10, 2013.