Trading Articles
Measuring The Markets With Pivots By Austin Passamonte
Price action across all financial markets adheres to repeated patterns and reacts to evolving price levels through any given period of time. Using dynamic pivots is one way to measure price action in any market. A critical piece of the trading puzzle is determining which way price trend will go. Stating the obvious? Well, yes and no. Trend is a highly relevant term, pertaining to the timeline of a trade’s expected hold time on a clock and/or distance on a chart. Do we intend to exit quickly or intraday for relatively small to modest gains? Hold through market noise for bigger gains? Overnight or beyond several sessions for trend trade gains? By definition, an uptrend for one relative time frame can be a downtrend for smaller or larger time frames.
You can measure price action in many different ways. Moving averages, trendlines, and basic floor trader pivots are some of many popular chart tools for determining price direction or trend. Floor trader pivots are calculated based on the average of the high, low, and close of the previous trading day. They tend to be static.
DYNAMIC PIVOTS
Another chart tool many traders aren’t familiar with is what I refer to as dynamic pivots. The dynamic pivots price study measures any time period’s range from its low to its high (zero percent to 100%). Price measurement values are plotted at 25%, 50%, and 75% retracement levels from low (zero) to high (100) peaks of the range. You could also add midlevel marks at 38% and 62% as important Fibonacci values. These overall price tool values could be Fibonacci based or fractional numbers based. In other words, using 0-25-33-50-66-75-100 or 0-23-38- 50-62-78-100 doesn’t seem to make much (if any) difference over a long period of time.
If you are inclined toward a strong belief in Fibonacci study, your choice is pretty obvious. Other traders are indifferent to Fibonacci and/or believe that fractional math is more appropriate. Without wandering too far off-track, there are various schools of thought on which specific numbers carry more relevance and weight in the live market setting. Whatever specific price values you choose, the measurement tool is based on a high and low measure of any given period. Each trading day will most likely give you different grid levels. There are no time period settings that are considered optimal.
Some chart tools that measure trend or directional bias are variable, while others are absolute values. Moving averages, oscillators, and trendlines will vary, depending on which time frame setting you use for each chart. Dynamic pivots are fixed or absolute measures: Regardless of time frame chosen, lines remain the same within any given time period measured.
TREND-FRIENDLY
There are several ways to use dynamic pivots, one of which is to use directional bias filters. In such a case, there are basically two scenarios: Either price action will continue to move in this direction, or there could be a possible trend reversal depending on where price stops and starts. A basic rule of thumb is this:
- Long positions when price is above the 75% level
- Short positions when price is below the 25% level
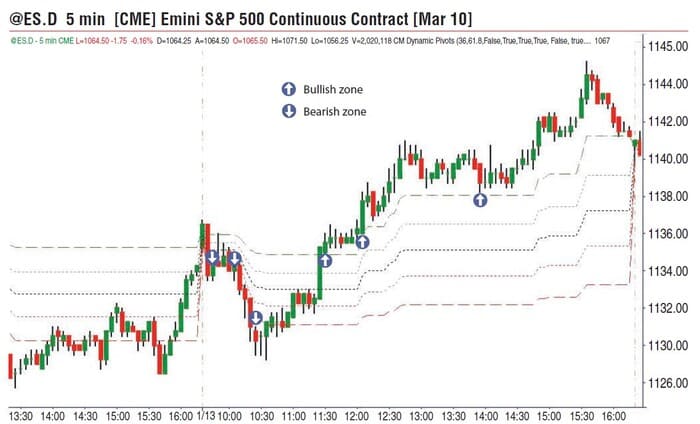
That rule alone will keep traders seeking long positions in a rising market and shorts in a falling market (Figure 1).
FULL-BULL ZONE
When price is near/at/above the upper 25 percentile of the overall price range, the strength of the momentum is obvious. Price has gained all of the (chart) ground from where measurement began at zero up to 100% peak highs. From there it has retraced roughly 25% of the total ascent and holds in that area. What we may be seeing is a directional market relaxing into the trend. There is no sign of weakness so there is no reason to believe price will not continue higher unless there is some type of overwhelming evidence otherwise. If we see some type of clear price-reversal pattern or price rejection at notable resistance points such as prior highs, gap fills, and price projection targets, then it is a visible warning that the uptrend may be ending.
I prefer to know when price action is near or above the 75-level or near/below the 25-level zones. This is because when price values are within the 25% to 75% range, you tend to see sequential stair-stepping and potential price magnets that can be used as secondary trade entry points. Financial markets spend 80% of their time moving sideways and 20% moving directionally. Whether or not this is accurate, the real opportunity for consistent, methodical profits lies in following price direction and momentum.
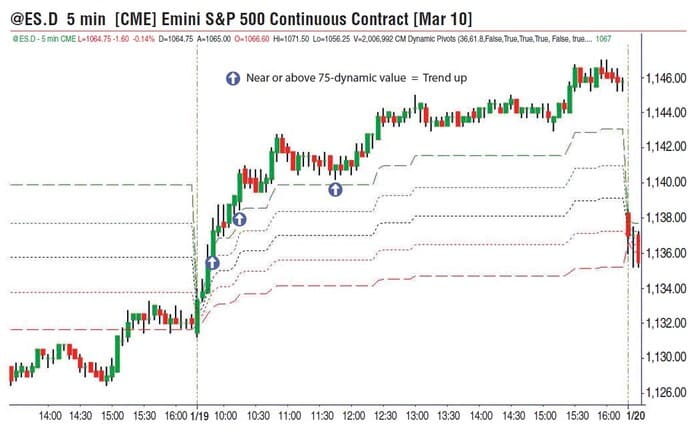
Fighting a trend is one of the biggest traps that traders set for themselves. It has probably drained more trading accounts than any other single factor. Respecting price strength or weakness when visible on its own percentile of range grid is an excellent way to flow with the market. But how can you tell the difference between an extended price swing that is running out of gas versus one with plenty left in the tank? When a market is near, at, and/or above the 75% level of its range, it means price is holding in the upper 25% of recent highs (Figure 2).
Suggested Books and Courses About Price Action
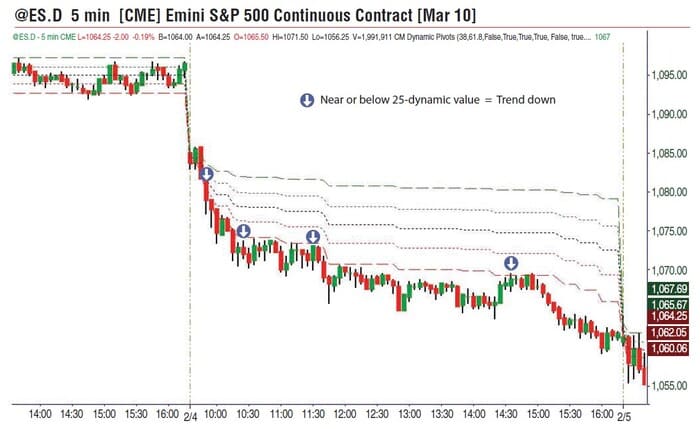
Market price in the bullish zone of the 75 level and above tends to continue sideways or higher for a while, offering pullbacks in price along the way for new long trade entries. After using this price tool for some time, I discovered that staying on the long side of trades when price is at or above the 75 dynamic level keeps me on the correct side of the market. All you have to do is keep buying the pullbacks and/or breakouts when price is holding steady above the 75 level, and by default, you stay on the correct side of trending price action more often than not. By nature, markets cycle up, down, and sideways. Sooner or later, price will reverse and drop back below the 75 zone of support and fall through the scale to trend below its 25 level (Figure 3).
BIG BEAR ZONE
When price is at or below its 25% level, it means the market rose from zero all the way to 100 and then gave up 75% of those overall gains. Market price in the bearish zone of the 25 level and below tends to continue sideways or lower for a while, offering pullbacks in price along the way for new short trade entries. Staying on the short side of trades when price is at or below the 25 dynamic level means you are on the correct side of the trending price action. Staying away from the long side while market price remains at or below the 25 zone keeps you from fighting the market trend.
TACTICAL MANAGEMENT
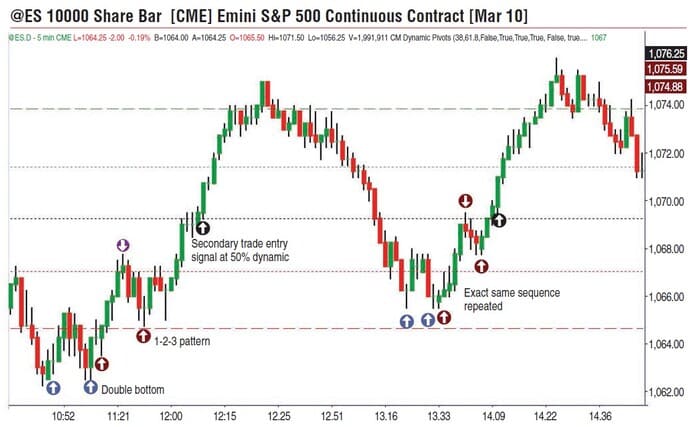
You could use the dynamic pivots for secondary trade entries and to place your stops. For example, if you look at the intraday chart of the March 2010 e-mini contract in Figure 4, note that in the early part of the trading day, the contract is trading toward a support level where you see a double-bottom pattern. In a while, you see a 1-2-3 reversal signal. Your primary trade entry tactic might be a pullback inside that pattern, or a breakout of that pattern that takes prices to the next dynamic level. As you can see from the chart, price moved up to the 50% level, which could be your secondary entry level.
You could use these dynamic levels as trailing stops or places to exit your trade. You could place stops below support levels for long trades or stops above resistance levels for short trades. This will keep your open positions on the favored side of the trend moves while protecting your losses at the same time.
SUMMATION
Some chart services offer the dynamic pivot tool, but it is relatively easy to write a custom program. You have to look at the current high-low range and calculate the 25%, (38%) 50%, (62%) and 75% levels of that range. The code for the dynamic pivot points can be seen Here: “EASYLANGUAGE FOR DYNAMIC PIVOTS”
Price action across all financial markets adheres to specific, repeated patterns when it comes to retracements. Prices react to these evolving price levels at any given period of time. Understanding these reactions will go a long way in adding to your trading success.
Austin Passamonte is a full-time professional trader who specializes in emini stock index futures and commodity markets. His trading approach uses general technical analysis and proprietary chart patterns. He trades privately in the Finger Lakes region of New York.