Trading Articles
Market Reactivity By Al Gietzen

Interpret what the market is saying by using some sound techniques. The market reactivity system, which can be applied to both stocks and commodity futures, is automated to provide computer-generated trade signals, largely eliminating trader judgment and the associated psychological pitfalls. My research on trading the futures markets started 25 years ago, when I delved into technical analysis to develop a trading strategy based on the underlying formation of market behavior. The result was an indicator that took a broader measure of the market, combining price data, trading range, and trading volume, and tying the result to an underlying cyclical market structure. By taking all this into account and applying the indicator to three or more different cycle lengths, it proved to be an effective system. Further, the indicator proved to be robust in that it could adapt to changing market conditions.
INTRO
Early on, it was clear that trading success had three basic requirements: a sound method, good money management, and a suitable mindset. The first two could be addressed analytically; the third, at least equally important, could not. So even with a system with an analytical basis and a set of rules, its application did not produce good results for the majority of traders. Applying indicators requires judgment, and judgment in a high-stakes activity is affected by psychological factors.
I attempted to automate the market reactivity system in order to eliminate, or at least reduce, the judgment factor. But I could not find a way that produced better results. In recent years, however, the markets have continued to become more complex, more volatile, and less cyclical, and I began working on it again. This time, I gained new insight into a way to make it work. The first thing I looked for in the development of the trading system was a structure upon which to build. Market response to fundamental factors is primarily a matter of trader/investor sentiment, and neither sentiment nor supply/demand changes are entirely random.
CYCLICAL STRUCTURE
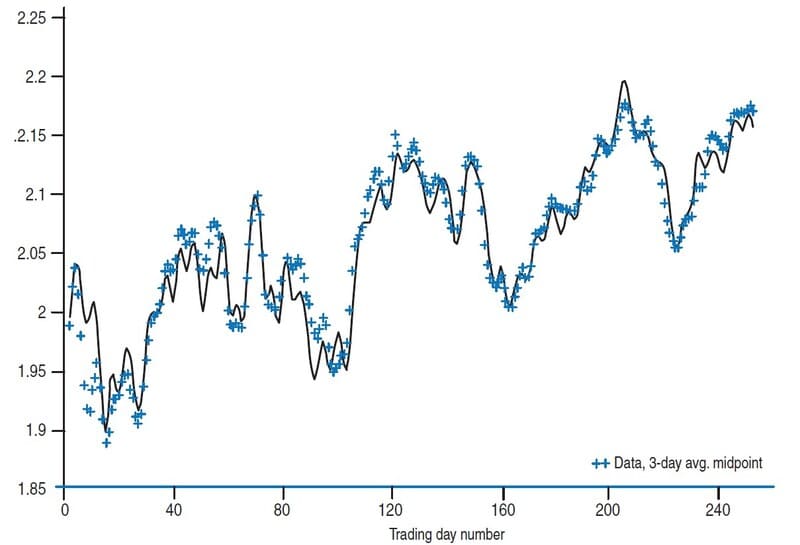
Price behavior varies in a way that can be described by a combination of cyclical patterns. There is nothing precise about the cyclical behavior of the markets, but analysis of the behavior provides a means by which to discover the nonrandom nature of the markets. Having the means for detecting that underlying structure allows the trader to adapt the indicator for detecting the key turning points in the markets. It also allows for adapting to shifts in the structure as the market’s behavior changes over time. The markets can be described as the sum of a series of sine waves of different periods and amplitudes, added to a longer-term underlying trend:
P = Plt + A1 sin T1 + A2 sin T2 … + An sin Tn
where P is the price, Plt is a long-term centered average, and A and T stand for amplitude and period, respectively. An example of the fitting of the analytical solution composed of a combination of cycles to the actual behavior of a market can be seen in Figure 1.
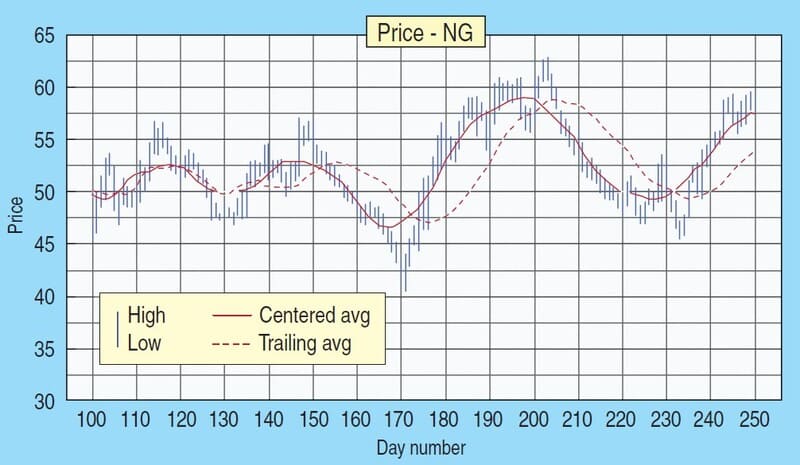
One of the keys used in the system to analyze the market structure is the centered average. It is an average over a given number of bars in a period but shifted back half the length of the period. This is a fairly simple concept and clearly more representative of the market price over a given period of time than the usual trailing average. But it has the disadvantage of lagging the current price bar by half the number of bars being considered (Figure 2).
It is a powerful tool used to determine the cyclical structure because it provides a means of filtering the price series to separate the individual cycles contained in the series — the process of detrending. A centered average of the price midpoint taken over a specified number of bars filters out all the cycles of that length or less. Then by subtracting a shorter average from a longer average, the cycles can be separated and the cycle content determined. I gave considerable attention to market cycles before developing the market reactivity system. I wanted to further investigate the complexity of the combined cycles and provide an analytical basis for describing the market. I also needed to separate approximate cycles of different periods (that is, detrending).
Once the cycles are determined, an indicator can be adapted to track each one and let you know when that cycle is turning. The effectiveness of many popular indicators depends on a length for the indicator consistent with some predominant cycle contained in the price series. One of the better ways of tracking a known cycle is with a momentum indicator, which determines the slope of the price curve as formed by the close or the midpoint of the series of bars. To track a cycle, a number of bars must represent half the cycle length. By itself, the momentum indicator is generally not an effective trading tool because it indicates an exit from a trending market at the cycle turns, even though the price may only go flat during a cycle bottoming.
Suggested Books and Courses About Market Cycles
The market reactivity indicator combines momentum with a broader measure of the market, which incorporates the price range and trading volume for each bar as well as over a period of the indicator. The broader measure is given by an aspect ratio α, which is the price range over the period of the indicator divided by the total trading volume for the period v. The formula for α becomes more complicated because it has to be normalized for a given commodity and for conditions of the recent past. This can be done by dividing range (r) and volume (v) by their average values for the recent past, R and V. The recent past is taken as the last three to four cycle lengths:
α= (r/R)/(v/V)
Reactivity ρ is then given by
ρ = α ∗ M
where M is the momentum and α is computed over the same period (number of bars) as the momentum. The period used for the momentum is slightly less than half the cycle length, 0.45 * cycle length. The average period range (R) also provides the upper and lower critical ranges (UCR and LCR).
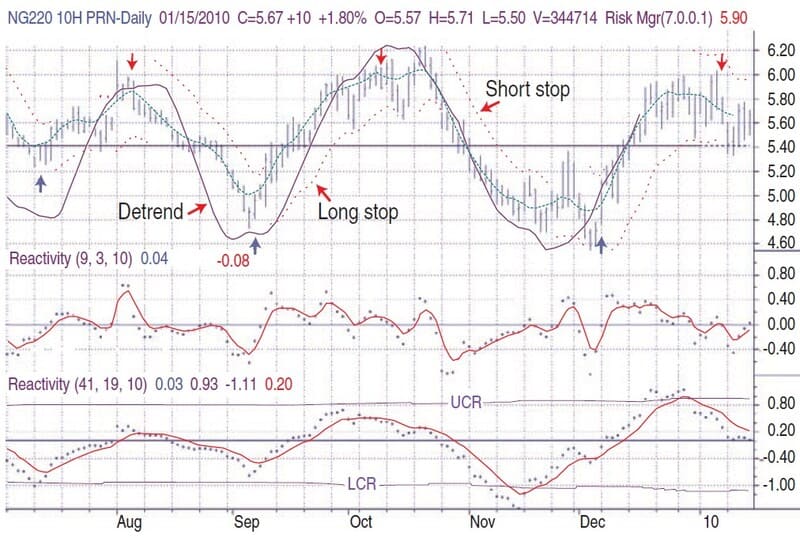
The application of the reactivity indicators can be seen in Figure 3. The concepts illustrated are the basis for determining the automated trades. Here, the principal entry and exit points are determined by observing the longer-term indicators as shown and triggered by the data-point for the short-term indicator crossing its smoothed line. Optional add-on trades are triggered the same way in the direction of the longer-term indicator. What is required for the automation is the effective use of the longer cycles to determine trend in a quantitative manner. In addition, note the detrend of the longer cycle that is overlaid on the price chart, as it is an important part of the discussion on determining the trend.
TWO ASPECTS, ONE ANSWER
So what’s the problem? There are two aspects to the answer. First of all, for the first 10 or 15 years of its application the system was very effective. Most markets had a somewhat consistent, approximate cycle content. In the last three to five years, as the markets made the transition from the pits to electronic, around-the-clock trading, the cycle content in the price series became more variable. Add to that the advent of the exchange traded funds (ETFs) bringing in the major funds as participants, and further changes came to the markets in the form of greater short-term volatility.
The second aspect is the requirement for patience and objectivity in evaluating indicators every day in order to achieve profitable results, which is not easy. As the market character changed, the application and objectivity became more difficult as well. In the legacy version, the presence of a strong underlying trend was indicated by the reactivity indicator penetrating the critical ranges, thereby telling the trader to stay in the trade until other conditions were met. This ability was an important factor and resulted from the incorporation of the price range and trading volume into the analysis. The increased volatility has made this aspect less consistent.
Still, there were some powerful tools built into the system. What was needed was less dependence on both the cycle content and the patience and objectivity of the trader. The reactivity indicators still provide a useful adjunct to the automated trade signals.
DETERMINING THE TREND
Two innovations were important in the development of the new approach: One was to find a way to determine the underlying trend that wasn’t lagging, and the other was to automate the generation of the trade signal at key turning points. In order to talk about a trend, it is also necessary to specify a time frame — short term, intermediate term, or long term. Trends are similar to, and related to, cycles. The short-term trend is determined by the direction of a short cycle and the long-term trend is determined by an underlying long-term cycle.
Most methods for estimating the trend such as trailing averages, average directional movement index (ADX), and so on are lagging indicators or inconsistent from one market to another. What is needed is a way to determine the intermediate- and longer-term trends based on what is happening now, which requires anticipating the change. These trends can then be used to determine the direction of the trade triggered on the basis of short-term behavior.
As we have seen, the centered average of the midpoint is a good representation of the price behavior, and so the direction of centered averages of different lengths gives an indication of the direction of the price trend. But, of course, the centered averages lag the current bar by half their length, so it is necessary to simulate the centered average going forward in order to get the current trends. As we have also seen, the indicator tracks the cycle content in a manner similar to the actual detrend of the cycle (Figure 3). And as we have noted, the detrends are computed from the centered averages. Therefore, the inverse must also be true; the centered averages can be computed from the detrend.
The breakthrough idea is to use the indicator as an extension of the detrend and then solve for the corresponding approximate centered average. Computing the short-term slope of that derived centered average then becomes a vehicle for determining the current trend. Applying this to intermediate- and long-term cycles in the price series allows a good estimation of the current trends, thereby allowing taking trades and building a position in the direction of the trend.
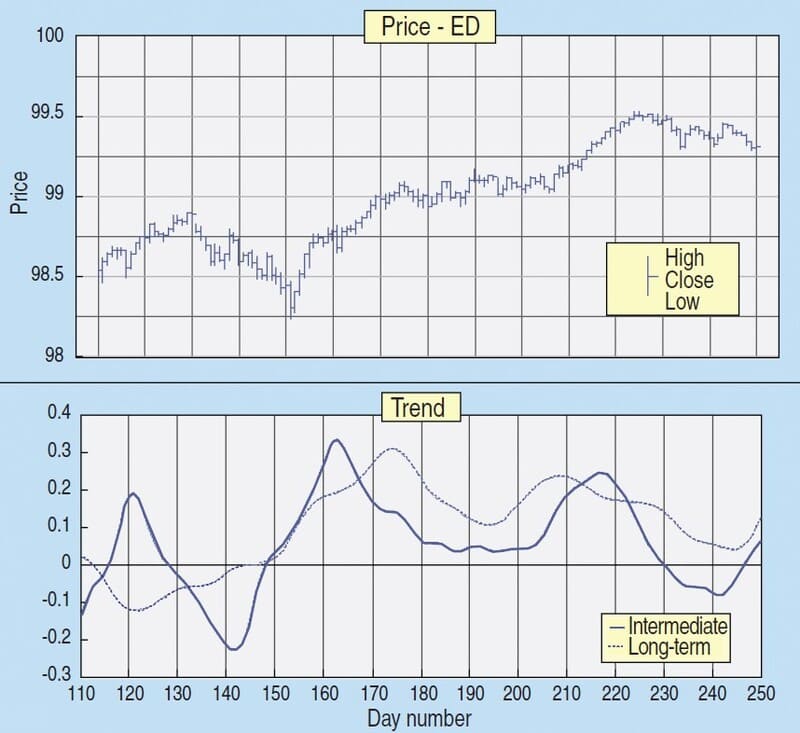
Figure 4 shows the relationship of the computed trends to the price for the intermediate term (trend 1) and for the longer term (trend 2). Trend 1 uses a four-bar slope with a 0.3 exponential average smoothing, while trend 2 uses a sev-en-day slope with 0.2 exponential average smoothing. If the trend is above the zero line it is positive; if it is below zero it is negative. Its magnitude indicates the strength of the trend, and crossing the zero line shows a change of the trend. Since the critical ranges by the reactivity indicators are no longer needed to indicate a strong trend, the analysis can be simplified by using ordinary momentum instead of reactivity as the indicators for extending the detrend for the derived averages.
TRIGGERING THE TRADE
The final piece of the puzzle is the automated triggering of the trades. Essentially, all price series have some sort of short cycle behavior, typically in the range of seven to 10 bars. Using the turning point in the reactivity indicator (that is, the calculated value crossing the smoothed line) for the short-term cycle provides a good means for determining the trade point. These trade points are then filtered by the intermediate- and long-term trends to initiate and add to a trade position.
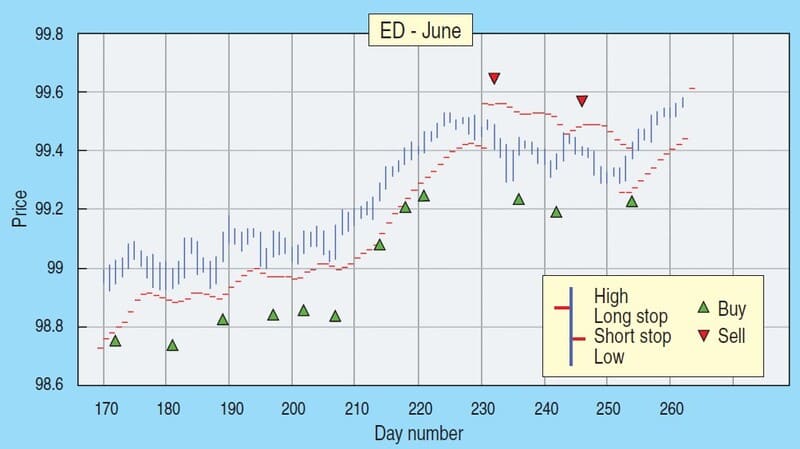
FIGURE 5: COMPUTED TRADE SIGNALS FOR EURODOLLARS (9/04/09–1/15/10)
Typical recent trade indications for end-of-day data are shown for eurodollars in Figure 5 and for lean hogs in Figure 6. Backtesting of the system was first done using commodity data from 2007 and 2008. The results showed phenomenal profits. Traders know that those years were not typical due to the very strong trends in that time. Nonetheless, the results showed the system to be effective in the strong trend conditions. Further backtesting was done on earlier data from 2005 and 2006, which still showed good results. Trading for 2009 also gave very good results, which can be seen for a number of different commodities at marketreactivity.com.
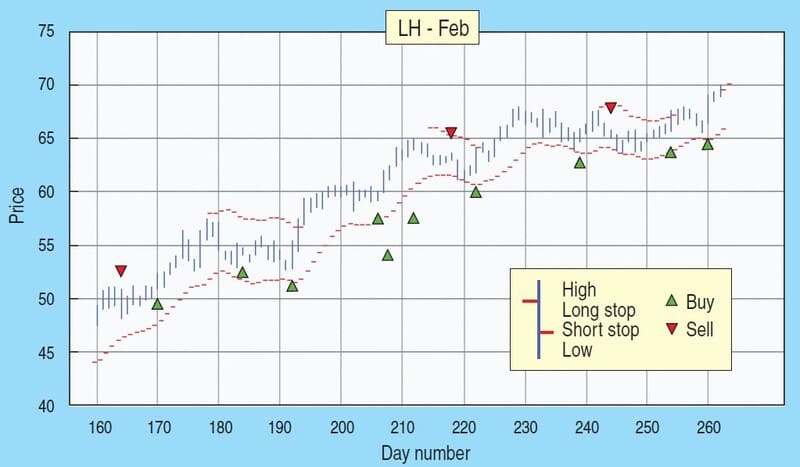
FIGURE 6: COMPUTED TRADE SIGNALS FOR LEAN HOGS (8/20/09–1/15/10)
The new version maintains the built-in stop-loss points based on statistical expectations of price variations. These points provide a good money management tool as well as providing trade points in certain instances where the trade triggers may miss a sudden change in direction. There is nothing magical or mysterious in the system and it doesn’t claim to foretell the future. It is simply the sound application of analytical techniques aimed at taking maximum advantage of what the market is telling us.
Al Gietzen has a master’s degree in nuclear engineering and has been an active futures trader for more than 20 years. He has a diverse background in engineering analysis, project management, acquisition analysis, business ownership, and consulting.