Trading Articles
Looking Forward With Yesterday’s Action By Anthony Trongone

Can you determine how prices will move after looking at yesterday’s price action? This analysis measures price movement on the S&P 500 SPDR exchange traded fund for the next three days. N0 matter how you finish the trading day, knowing how the market will perform over the next few trading days can provide you with a competitive advantage. How can you do it? You can run an analysis that measures the results of the next three days after the Standard & Poor’s 500 depositary receipt (SPDR) exchange traded fund (SPY) experiences a price movement.
For instance, after the SPY produces a trading day advance of 2.5%, how does it perform one, two, or three days after this upside rally? Are these results comparable over the next three days? Does a 1.5% run to the upside respond differently, or is it more profitable to purchase the SPY after it experiences less of an upside move? Are these results likely to hold for a large, moderate, or small downside loss?
Success comes from playing the percentages; by making an assessment of the existing trading environment; performing your analysis; and formulating your trading decisions without emotional distractions. Nevertheless, it is difficult to put the percentages on your side without knowing how the equities market performs after a range of moves. Getting this information and using it effectively can separate an unexceptional performance from an excellent one.
THE SPIDERS
The SPY (also known as the “spiders”), with an average daily trading volume of 242 million shares, outpace the market in the ETFs category. As the most active instrument, the spiders offer the best representation of investor psychology. With extremely active pre- and aftermarket trading volume, the spiders are an attractive trading choice, since it normally has just a penny difference between the bid and the ask prices. This liquidity is an important feature because few instruments offer the investor a reasonable bidding price to buy or asking price to sell outside of the regular trading session.
This ETF allows investors to participate in the collective intraday performance of the 500 companies in this popular index; however, it trades with the precision of a single security. Besides tracking these companies, it has an almost perfect correlation with the S&P 500 futures, which offers us another advantage because you can actively trade this futures contract as a replacement for the spiders during the day or the night. This mini contract (ES) trades internationally around the clock at a dazzling speed with small differences between the bid/ask price.
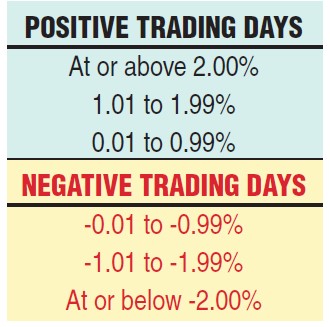
In addition to these advantages, it also has complete transparency. You can obtain a comprehensive listing of these companies, which embodies two-thirds of the total value of all US stocks, by going to www.sectorspdr.com. To complete this analysis, I break the daily price movements of the spiders into six categories with two brackets, separating positive from negative trading days (Figure 1).
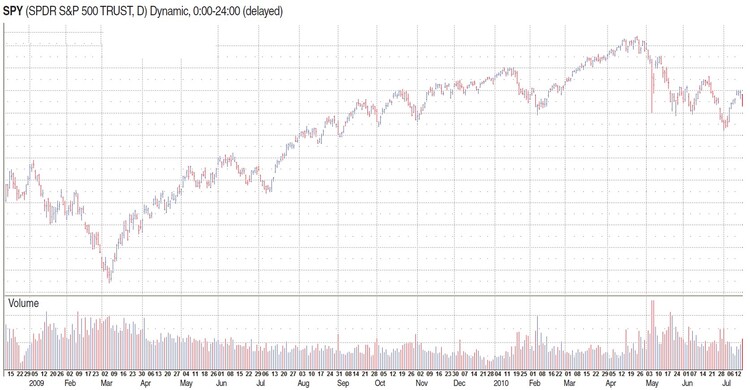
Before you begin studying a particular trading system, always assess the market environment for those days under investigation. A line chart of the 366 trading days in Figure 2 illustrates a steadily rising market with two perceptible corrections. These “bookend setbacks” occur at the opening of trading on January 2, 2009, when the spiders stood at $90.44. They promptly began falling, hitting a price of $67.10, before they turned and eventually ran up to $121.81. The analysis runs for six quarters, ending on June 30, 2010, at a closing price of $103.22.
DIFFERENCES IN TRADING VOLUME
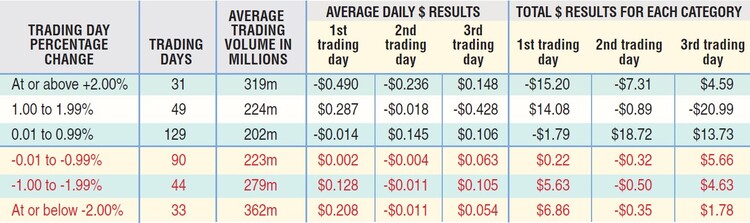
Figure 3, which provides the percentage change in the daily price of the spiders, is broken down into three advancing (top half) as well as three declining (bottom half) categories. When comparing trading volume across each category, a negative day has more activity in comparison to a positive trading day within the same price change bracket.
Suggested Books and Courses About Price Action
COMPARISONS AFTER ONE TRADING DAY
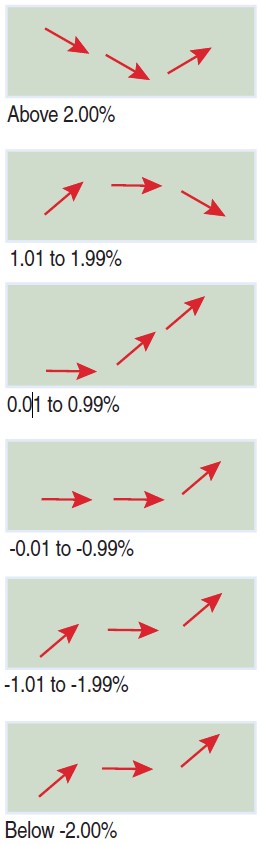
In Figure 4, the three red arrows point to the three-day direction of price movements of each category. After experiencing a loss of 2% or more, the spiders sprang back the next day, fl attened out the day after that, and rallied again on the third day.
STRONG PERFORMANCE (≥ 2% ADVANCE)
After a stellar performance in evaluating the average results, this category gave us two days of corrections. The next trading day, the spiders had its largest daily decline (-49.0 cents). These 31 days had a losing record (13 advances versus 18 declines = 0.419), but more discouraging was the mismatch between the one day it rose above a dollar profit from those nine days it fell below a dollar loss.
These declines continued into the second day; the average loss was 23.6 cents. It wasn’t until the third day that the spiders regained their footing, producing $4.59 cumulative profit in 31 days.
MODERATE PERFORMANCE (1.01% TO 1.99%)
After a modest increase, the spiders continued to perform strongly. The next trading day had an average profit of 28.7 cents, and its 29–20 record produced the highest winning percentage. Further, in counting the advances above or below a dollar, the upside had a five-day advantage.
On the second day, however, the spiders were flat (slightly below two pennies per day, with more advancing days: 27 to 22). Three days later, it fell into the red, losing a total of $20.99 in 49 trading days.
MILD PERFORMANCE
Considering those days after a positive performance, a slightly upward daily price increase offers us the most attractive three-day results, even after a slow start. The first day after a modest advance (0.01 to 0.99), the average daily returns were -1.4, 14.5, and 10.6 cents, respectively. In the 129 trading days, these averages saw a next-day loss of $1.79, but there appears to be a profitable opportunity on the second ($18.72) and ($13.73) third days.
NEGATIVE PERFORMANCE
Within the three days of a decline, the spiders were able to make a comeback in every category. The red arrows point to the direction of these recoveries. Despite the magnitude of the loss, the second-day results were nondirectional (I am defining a nondirectional loss as an average result of fewer than two cents). Across the three categories, the third day produced a small profit. In the 167 days in this negative category, the record for each category was 93 wins and 74 losses (first day), 86 wins and 81 losses (second day), and 91 wins and 76 losses for the third day after a loss. As you can determine from the average scores, it appears that the steeper the setback, the more impressive the next-day recovery.
REPEAT PERFORMANCES
The results by themselves are interesting; however, an average score can downplay the results. For instance, given two days, if one day rallies 2% but the other falls 2%, the average gives us little information about these two days. To overcome this statistical deficiency, I am putting the results of the two outlying categories (above/below 2%) into one of the six categories (Figure 5).
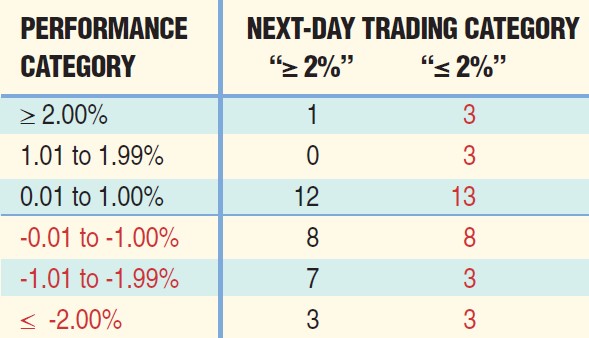
After a 2% change, the spiders were able to repeat this performance on only one occasion but unable to produce a day in the midpositive range category. In fact, 12 of its 13 positive days made it into the “mild” category. In looking at the declining days, 10 crept into the two most aggressive negative categories. Conversely, the next-day results after a negative finish displayed more balance between the performance categories.
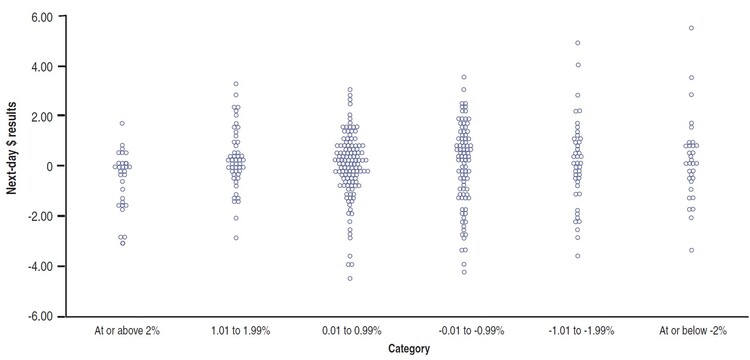
Figure 6 separates the performance of the spiders on the following day after closing in a particular category. For instance, when closing at or above 2%, the next-day results held closely together, but there was an obvious skew to the negative. The mildly positive category shows more thickness in the middle, and so, more consistency in predicting the next day’s outcome. Conversely, since the two most negative categories carry the most deviation, they are the most difficult to forecast.
YESTERDAY’S ACTION SAYS A LOT
Regardless of the category, after a decline in the spiders, the results were similar: the steeper the decline, the more impressive the first-day results. Although the uptick in price fades on the second day, a modest rally appears to resurface on the third day.
According to the statistics, by taking an inverse position, you are putting the percentages in your corner. In looking at the extreme categories, we did encounter one day with a repeat positive performance and three days with back-to-back losses. Taking a contrarian position is not always profitable, and it is especially painful to watch as the market keeps rising while you are betting against another upside run.
Be careful extrapolating these results because during the time period covered in this study, the spiders did not experience a bearish market; the fear of a long downturn was minimal. On the other hand, from October 12, 2007, until March 28, 2008, the spiders fell from $156.33 to $131.51. During this time, they accrued losses of more than $1.00 in 45 of these 115 trading days. Always be cautious of the bear. It often invalidates the performance results of any trading system.
In itself, this article is instructive, but it does not look at the entire trading system. Not included is my analysis on trading volume. In a future article, I will discuss how trading volume affects each category, specifically comparing the performance of the spiders within each category, and together, these two articles will paint a more realistic picture of what we can expect going forward, looking back.
Anthony Trongone has taught graduate courses in psychology, as well as graduate courses in finance, investing for capital appreciation, and quantitative analysis in the US and across Asia. As one of 25 Master Educators for eSignal, he regularly writes articles on current investment strategies.