Trading Articles
How Failed Signals Trigger Fast Market Moves – Jeff Cooper’s Strategy
Intro
Most traders have heard the advice KISS–“Keep It Simple, Stupid.” As trite as it may sound, there is a good deal of wisdom behind the phrase. Similarly, everyone has heard the expression that the three most important rules in real estate are location, location, and location. From my perspective, the three most important rules in trading are focus, focus, and more focus. Short-term traders don’t have the luxury of analyzing news or fancy indicators in the heat of battle. To prosper, you must have a framework from which to react quickly and ask questions later. For me, keeping it simple means focusing on price action, either on a daily, weekly, or intraday basis. The tale of the tape lies in listening to stock speak through the patterns created by buyers and sellers.
Money makes price, and price makes pattern. All other indicators are secondary-that is, they are derived from price, or price and volume combined. My father, a great tape reader, used to tell me, “Stocks don’t move, they are moved.” Wall Street can be a perverse place; not everything is always as it seems. Sometimes a breakout is generated to facilitate a large player who needs to unload inventory. Sometimes a flush-out is orchestrated to facilitate accumulation by smart money. It pays to believe what you see, but with a twinge of cynicism. Because fast moves often come from false moves, larger-than-average profits can result when most traders are caught on the wrong side of the market. Some of my best gains have come from being on the wrong side of a situation, getting stopped out, and going the other way.
Triangle Pendulums
Large moves often come out of triangles, and when the moves are preceded by false breakouts, the price explosion is even larger. If we filter triangle breakout signals by requiring a strong trend to be present, the ensuing move has the potential to be truly dynamic. A Triangle Pendulum is a strong move out of a triangle pattern that follows an false breakout it the opposite direction. Let’s take a look at a few examples and you’ll see what I mean.
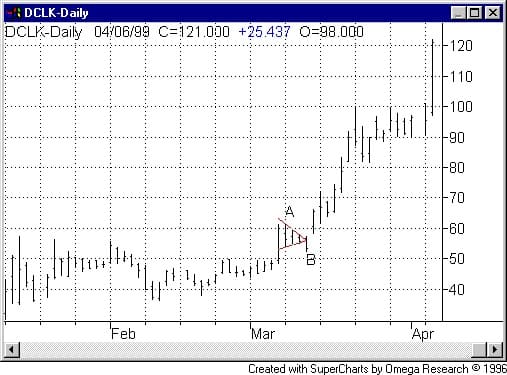
In Figure 1, after a large-range breakout on March 5, 1999, DoubleClick (DCLK) forms a high-level triangle, making a series of lower intraday highs and higher intraday lows from March 8 through March 10 (A). On Thursday, March 11, DCLK breaks down through the triangle pattern and closes near the low of the day (B). This action called the original breakout into question and certainly stopped out most short-term players.
Advanced Books and Courses on Price Action Trading


However, the next day (March 12), DCLK gapped open over the high of the breakdown day, triggering a triangle pendulum buy signal and reasserting the underlying trend. Yes, it’s difficult to chase the stock (particularly after being stopped out), but in my experience it is often the hard thing to do in trading that pays.
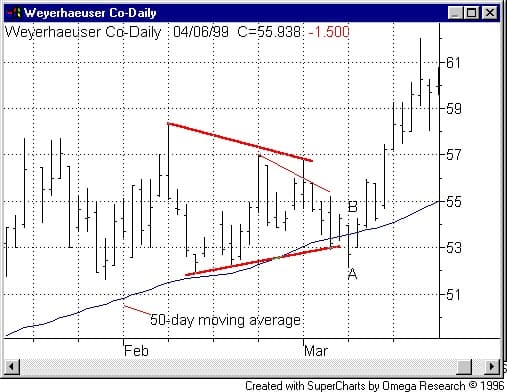
In Figure 2, Wyerhauser (WY) formed a complex triangle between February 8 and March 4. On March 8 WY broke through the bottom of the triangle, closing below its 50-day moving average for the first time this year (A). The situation looked bleak and it appeared as if a distributive top in making was unraveling. But what happened next underscores the concept that follow-through is key: It’s not a breakout or a signal in and of itself that’s crucial, but the subsequent behavior that’s important. When WY took out the high of the breakdown day (March 8) the following day, it triggered a Triangle Pendulum buy signal (B). The stock traded five points higher (over 10%) within four days.
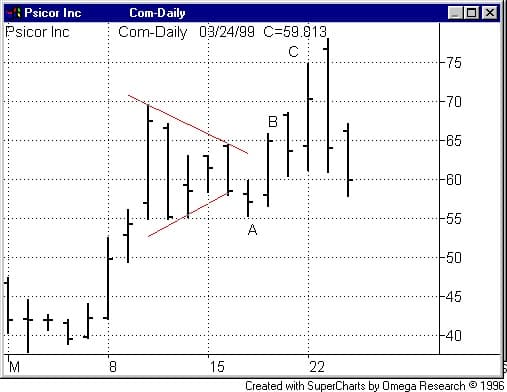
Psicor (PCOR) provides another interesting Triangle Pendulum example (see Figure 3). On March 17, PCOR violated a triangle pattern (A) to the downside. However, the next day, when PCOR took out the high of the breakdown day (March 17), it triggered a buy at 59 7/8. Later the same day, PCOR trades up to as high as 65 æ (B). Because PCOR closed near the high of the range, it’s a good carry-over prospect. The next morning the stock gaps open to 68 º (C). Entering the stock after the apparent triangle breakdown is offset captures an almost 10-point gain in just over one day.
Considering the Short Side
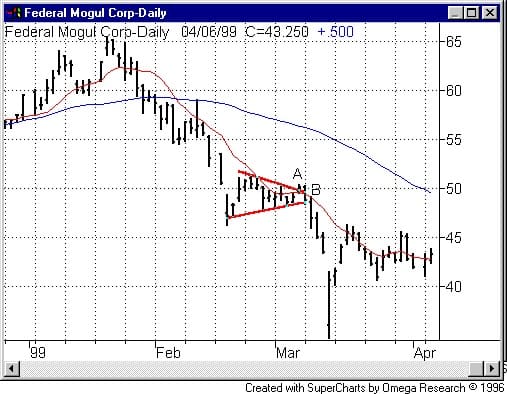
Triangle Pendulums work on the down side of the market as well. Last February Federal Mogul (FMO) was in a solid downtrend, trading below its declining 10- and 50-day moving averages (see Figure 4). On March 5, FMO made a subtle attempt to break out of a tight triangle (and above its 10-day moving average) and closed well, probably inspiring some short covering (A). However, on Monday, March 8, the die was cast when FMO pivoted back below the prior day’s lows, triggering a triangle pendulum sell signal (B) and an accelerated decline.
In Figure 5, LGTO is a terrific example of back-to-back failed breakouts. From March 10 to March 17, LGTO forms a tight triangle. Although the stock had traded slightly above its 50-day moving average, the resumption of the uptrend was in doubt because the stock had previously collapsed quickly off its highs. When LGTO broke out of the triangle on March 18 (A), it failed, leaving a long tail and an outside day reversal (B). The following day, LGTO triggered a Triangle Pendulum sell signal when it traded below the prior day’s low of 54 æ (C). As you can see, the stock lost 10 points in three days.
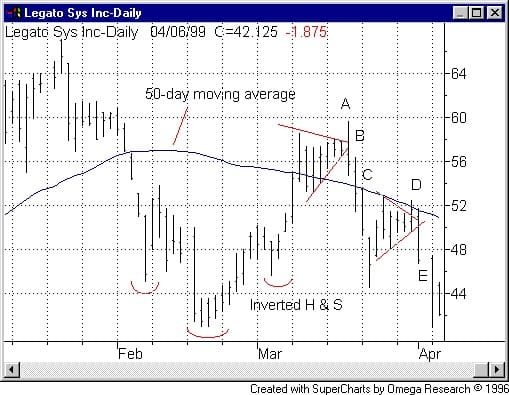
After a three-day waterfall, LGTO gives the appearance of a potentially bullish continuation pattern and proceeds to form another short-term triangle from March 25 through March 30. On March 31, the stock attempts to break out of the triangle (D), and closes near the top of its range. However, the next day, LGTO triggers a Triangle Pendulum sell signal when it takes out the low of 49 æ (E) of the unsuccessful breakout day, subsequently trading three points lower.
False signals offer excellent opportunities for knowledgeable traders with the patience to look past initial breakout signals–fast moves often result when traders get caught on the wrong side of the market. Triangle Pendulums capitalize on this characteristic, trading in the opposite direction of initial triangle breakouts.
I’m not sure where you’re getting your information, but great topic. I needs to spend some time learning much more or understanding more.
Thanks for magnificent information I was looking for this info for my mission.