Trading Articles
Looking At Other Markets By Gail Mercer

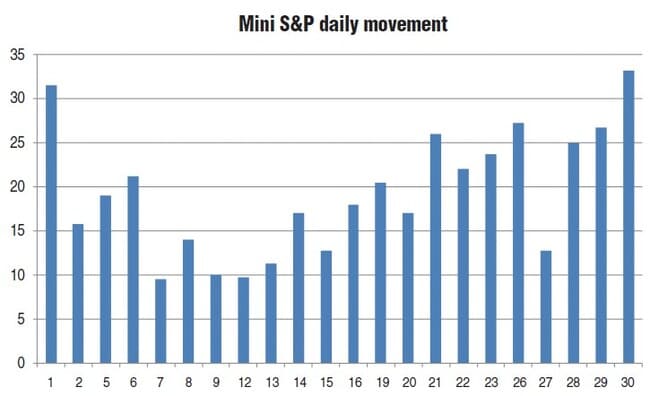
Most new traders gravitate to the S&P mini because of its average price range. But here’s a look at daily price movement in the currency futures vs. that of the S&P 500. Which one has larger price movements? Many new traders begin their trading experience on the mini indexes, with a primary focus on the mini Standard & Poor’s 500, as either a scalping trader or an intraday trader. Their daily profit target is normally between three to five points (at $50 per point). Sounds reasonable, right? Wrong! For an experienced scalping trader, this could be done, but not very likely for a new trader. To understand why, we need to look at the daily movement of the mini S&P. For October 2009, the mini S&P moved 19.27 points per day on average. Therefore, if the objective is to capture five points a day, a new trader is trying to capture 26% of the daily movement, which is quite hard for someone new to trading. Now, let’s take this a step further and look at the individual daily movement.
MEASURING DAILY MOVEMENT
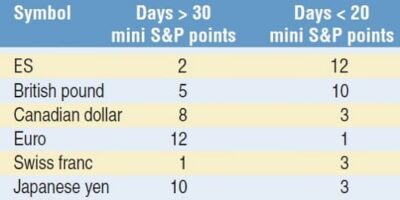
As you can see from Figure 1, in October, out of 22 days, there were only two days in which the S&P moved more than 30 points and 12 days that the mini S&P moved less than 20 points, making it even harder to capture the daily profit goal of five points. (When the mini S&P moves more than 30 points, the five-point daily goal is only 16% of the daily range, making it easier to capture the daily goal, provided the movement is after 9:30 am ET.)
Now, let’s take a look at just one of the currency futures — the Australian dollar (AD). (The Australian dollar has a point value of $10 per point; each price increment is considered a point.) The AD moves on average of 142.09 points per day (the equivalent of 28.42 mini S&P points). Using the same goal of five mini S&P points per day, the new trader is only trying to capture 17.5% of the daily movement.
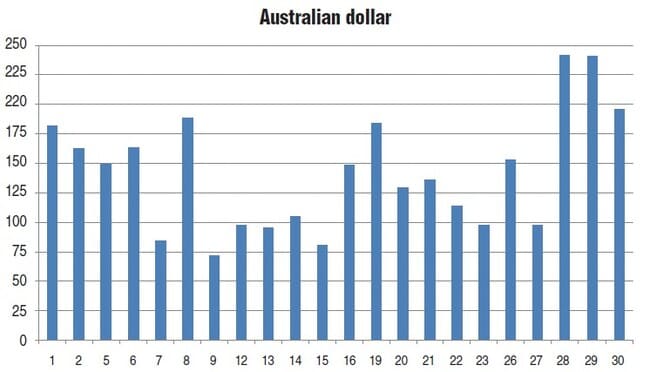
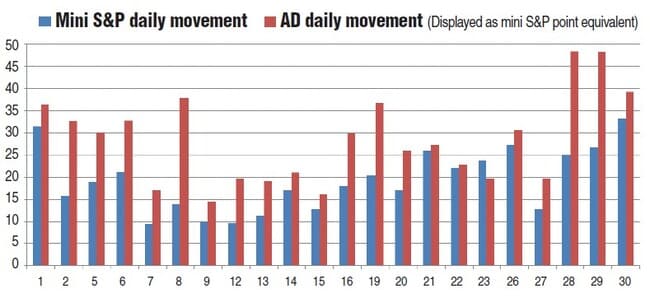
Again, if we go one step further and look at the daily movement, we see that for October (Figure 2), out of 22 trading days, there were 10 days in which the AD moved 150 or more points (a five-point mini S&P equivalent goal these days is 16.6% or less of the daily range). In addition, there were seven days that the AD moved less than 100 points (a five-point mini S&P equivalent on these days is 25% or more of the daily range). If you compare mini S&P and AD, you will see from Figure 3 that a trader had more opportunity to capture the equivalent of five S&P points by trading the AD rather than the mini S&P (10 days versus two). The AD also had fewer days of slow movement (seven days versus 12 days).
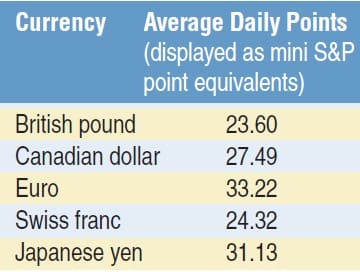
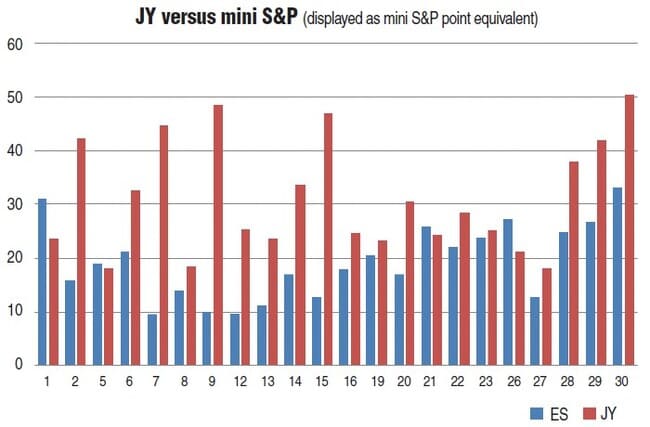
We can take this analogy further and compare each of the other five currency futures to the mini S&P to see if there are one or two currencies that stand out. The October daily averages for the five other currencies (stated as mini S&P equivalencies) can be seen in Figure 4. The euro and yen are the two that stand out with an average daily movement of 33.22 and 31.13 (mini S&P point equivalent).
Suggested Books and Courses About Commodity and Futures
We have already established that on days where there is a greater than 30-point mini S&P movement, the five-point daily profit goal is only 16.6% of the daily movement. And on days where the daily movement is fewer than 20 points, the five-point daily profit goal is greater than 25%.
We can now look to see how many days the currency futures moved more than the equivalent of 30 mini S&P points or fewer than 20 mini S&P points. As you can surmise from Figure 5, the mini S&P had more slow days (fewer than 20 points) than any of the currency futures. In addition, with the exception of the Swiss franc, the mini S&P had fewer, greater than 30-point days than the currency futures.

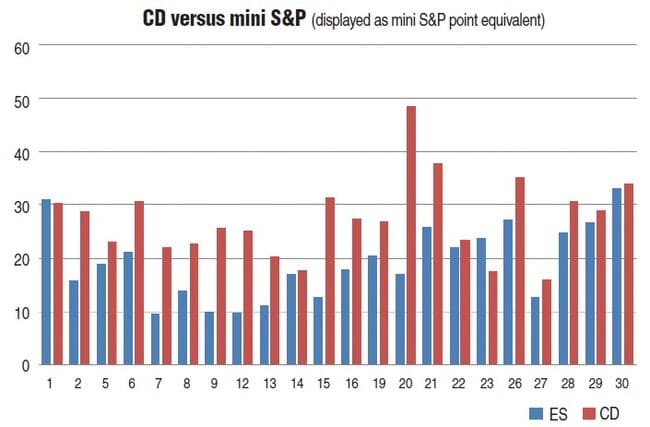
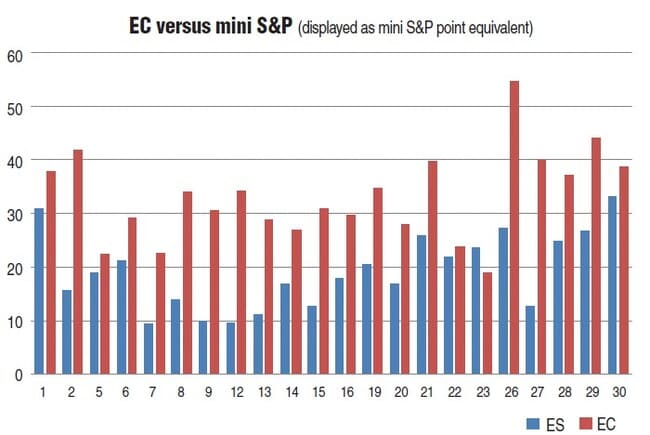
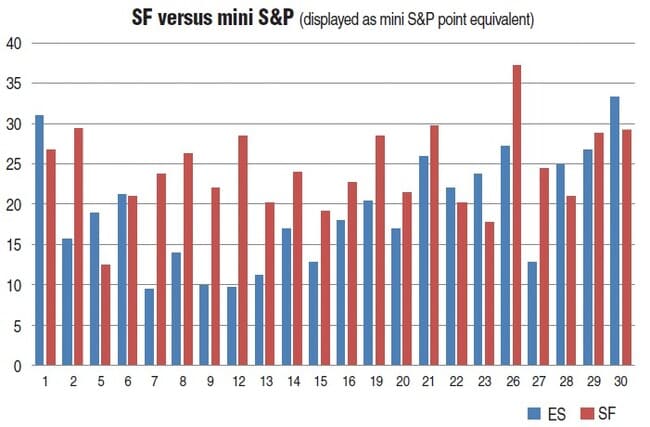
The actual per day movement (displayed as mini S&P point equivalents) on each of the currency futures can be seen in Figures 6 to 10. Figure 6 compares the mini S&P to the British pound (BP), Figure 7 with the Canadian dollar (CD), Figure 8 with the euro (EC), Figure 9 with the Swiss franc (SF), and Figure 10 with the Japanese yen (JY).
Since we have identified EC and JY as having the most movement in the currency futures, we can also adjust our daily profit target to one that is more realistic for a new trader, one with little market experience. Since the euro and the yen moves an average of more than 30 points, a more realistic expectation would be to capture only three points per day (only 10% of the average daily movement). By changing the markets traded and setting a more realistic goal, a new trader can increase their number of profitable traders. In addition, the currency futures offer multiple openings — not just the US market opening. The Asian session or the European session are often better sessions to trade for a new trader because they are quite often smoother and less volatile than the US market open.
WHEN DO PRICE MOVEMENTS OCCUR?
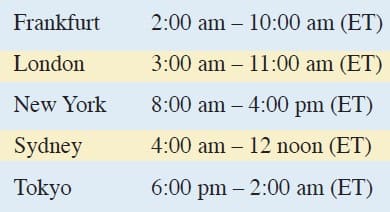
We looked at the average daily movement of the mini S&P 500 versus the average daily movement of the currency futures. We identified the euro and yen as the biggest daily movers. However, in order to truly understand the price movement of the instrument we are trading, we also need to know when price movements occur. For example, when trading the euro, should we only trade the European and US open, or can we also trade the Asian session? Is there a particular session that gives us insight as to the volatility for the next trading period? Is high volatility really good for the euro, or can we make money in the low-volatility areas as well? To answer some of these questions, let’s look at a simple graph of the average range of movements for each session opening period as well as the hours of the US session for October 2009. For this study, we used the following times for market openings:
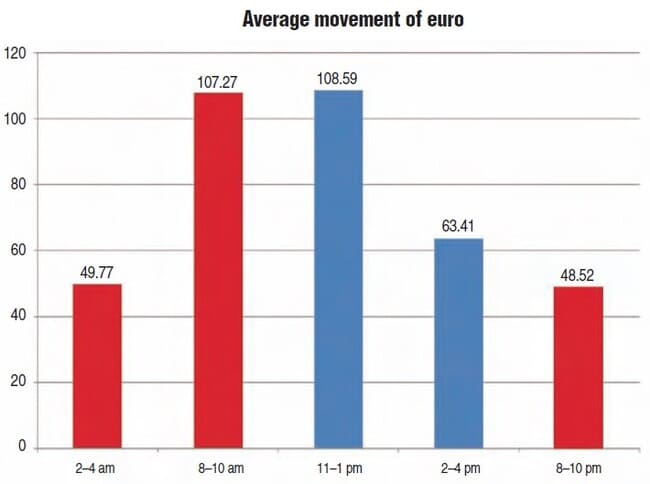
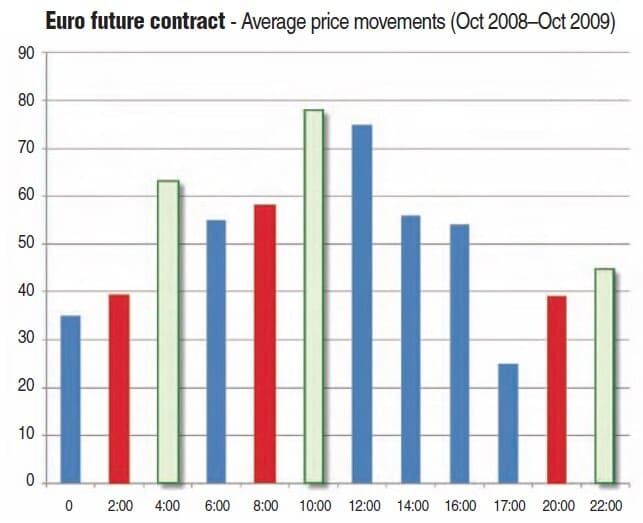
As you can see from Figure 11, the euro’s biggest average movement is actually from 11 am to 1 pm Eastern time and the euro’s second biggest average movement is from 8 am to 10 am. Neither of these times is a market opening session. The data here is only for one month, so we should analyze more data and more periods. Figure 12 is for the previous one-year period (October 2008–October 2009) in 120-minute increments, with each market opening highlighted in red.
OBSERVATIONS
Again, we see that the average highest range of movement is from 10:00 am to 12 noon, the second-highest average range of movement is from noon to 2:00 pm and the third-highest average range of movement is from 4 am to 6 am. Again, none of the highest average range of movements is during the market openings. In fact, it seems that the highest range of movement is after the market opening sessions. Another interesting fact is that each of the average ranges for the 120-minute time period post-market opening is greater than the actual market opening period (marked as light green bars). Now that we have identified the period of highest range movement, we can now incorporate these markets and times into our trading plan for successful trading.
Gail Mercer is a trader, director, and instructor for tradershelpdesk.com, and is known as an “indicator expert.” Mercer hosts a free live trading room where she teaches forex and index traders how to approach the markets. She currently trades futures, forex, indexes, and stocks.