Trading Articles
In The Volume Zone By Walid Khalil and David Steckler

Here’s a look at the volume zone oscillator, which can be applied to trending and nontrending markets. Find out how it can be used to trade the DJIA, SPY, and gold. axiom of technical analysis states that An with few exceptions, all technical indicators can be classified as either trending or oscillating (nontrending) in their design. This new indicator, the volume zone oscillator (Vzo), addresses both. In his book Technical Analysis Of The Financial Markets, John J. Murphy explains that using oscillators provides three benefits:
- Overbought and oversold conditions warn that price trend is overextended and vulnerable.
- Divergence between oscillator and price action shows hidden strength or weakness in the market, which is not apparent in the price action.
- The crossing of the zero line can give an important trading signal.
The formula depends on only one condition: If today’s closing price is higher than yesterday’s, then the volume will have a positive value (bullish). Otherwise, it will have a negative value (bearish). So:
Volume zone oscillator = 100 x (VP/TV)
where:
VP (Volume position) = X-days EMA (± volume)
and
TV (Total volume) = X-days EMA (volume)
THE VOLUME ZONE OSCILLATOR
Volume is simply the number of shares or contracts that have been traded throughout the day, so the higher the volume, the more active the security. Volume is always treated as a secondary indicator, despite its importance in confirming trends and chart patterns. Volume analysis is a key component of analyzing and predicting the future direction of an asset. Joe Granville introduced the on-balance volume (OBV) indicator in his Granville’s New Key To Stock Market Profits. This was one of the first and most popular indicators to measure positive and negative volume flow. The concept behind OBV is that volume precedes price. OBV adds a period’s volume when the close is up and subtracts the period’s volume when the close is down.
Unlike the OBV, which discards such criteria, VZO takes into account both time and volume fluctuations from bearish to bullish and vice versa. VZO takes volume actions one step forward by smoothing the volume and plotting such actions in the form of an oscillator, not as a trend-following indicator like the OBV. These modifications take the form of a leading indicator that provides buy/sell signals based on oversold/overbought behavior.
VOLUME ZONE OSCILLATOR CODE
With appreciation to AAPTA member Bob Fulks for assistance with the TradeStation coding.
TRADESTATION – Volume zone oscillator:
Input: Period(14);
Vars: MV(0), R(0), VP(0), TV(0), VZO(0);MV = iff(DataCompression >= 2, AbsValue(Volume),Ticks);
R = Sign(Close – Close[1]) * MV; VP = XAverage(R, Period);
TV = Xaverage(MV, Period);if TV <> 0 then VZO = 100 * VP / TV;
Plot1(VZO, “VZO”);
Plot2(+60, “+60”);
Plot3(+40, “+40”);
Plot4(+15, “+15”);
Plot5(-5, “-5”);
Plot6(-40, “-40”);
Plot7(-60, “-60”);
Plot99(0, “zero”);
METASTOCK – Volume zone oscillator:
Period := Input(“Y” ,2 ,200 ,14 ); R :=If(C>Ref(C,-1),V,-V);
VP :=Mov(R,Period ,E);
TV :=Mov(V,Period ,E);
VZO :=100*(VP/TV);
VZO
The VZO discerns bullish volume from bearish volume and is useful for identifying at which zone (bullish or bearish) volume is positioned. The oscillator is plotted on a vertical scale of -100 to +100. Movements above +40 are considered overbought, while an oversold condition would be a move under -40. Movements above +60 mark extreme overbought levels, while an extreme oversold condition is a move under
-60. The zero line demonstrates equilibrium between buyers and sellers. The components of the VZO system are:
- 60-period exponential moving average (EMA)
- 14-period average directional movement index (ADX)
- Seven oscillator zones: +60, +40, +15, zero, -5, -40, and -60.
VZO CLARIFIES MONEY FLOW
Volume figures alone do not provide a clear money flow analysis or even explain changes in volume attitude during different trends; VZO analysis can add important information about the trend as well as a clear money flow analysis. VZO movements and its money flow analysis also explain Dow theory’s trend phases of accumulation, public participation, and distribution. Figure 1 displays more than three years of Dow Jones Industrial Average (DJIA) weekly data, numbered at points discussed in detail, and the zones are colored, according to their trend.
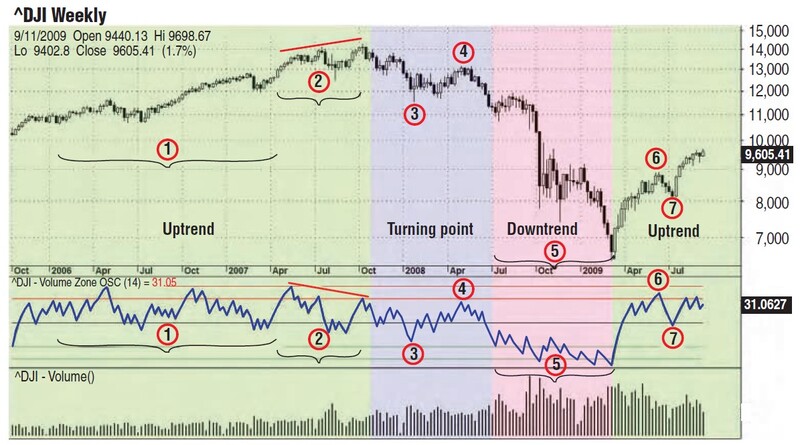
The chart shows only the four major zones (+60, +40, -40, -60) plus zero (horizontal black line):
- During the uptrend period starting from October 2005 until October 2007 (area 1), VZO was moving with the trend, fluctuating between the zero line and the upper zone (public participation phase).
- At area 2, price was rising normally while the VZO was declining, forming a negative divergence (distribution phase).
- At turning point zone 3, VZO has made a new two-year low, giving a warning that more shares than usual have been distributed (distribution phase).
- At point 4, for the first time in more than two years, VZO has failed to reach the upper boundary, giving another warning that bears are taking control (distribution phase).
- At zone 5, VZO clearly shows the heavy selling pressure confirming the downtrend (panic & public participation phase).
- At point 6, and for the first time since April 2007, VZO has reached +40, indicating new money flows (accumulation phase).
- Finally, at point 7, VZO has rebounded from the zero line without reaching -40, indicating an uptrend attitude (accumulation phase).
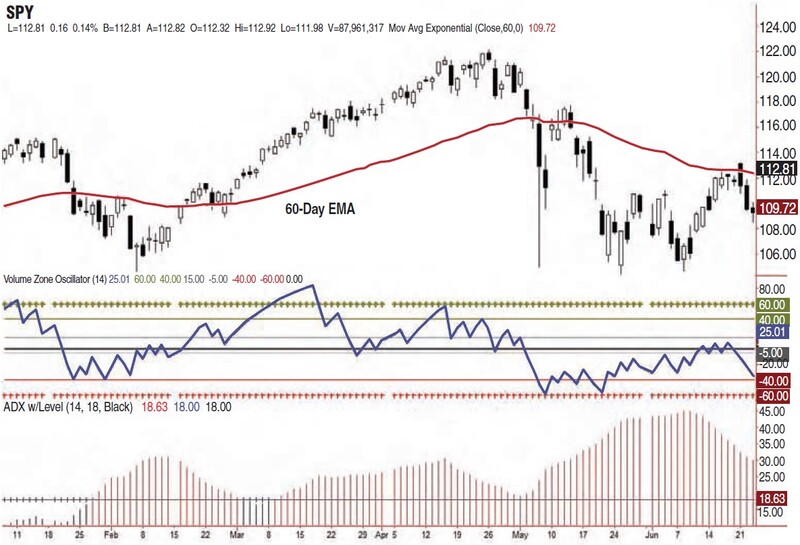
The volume zone oscillator is useful in uptrending, down-trending, or sideways market conditions. The following examples of the VZO include the seven oscillator zones: +60 is marked with green crosses, the +40 with a green line, the +15 with a gray line, zero with a black line, ‑5 with a light blue line, ‑40 with a red line, and ‑60 with red crosses. The zones are marked on the daily Spy with Vzo in Figure 2.
UPTREND PSYCHOLOGY
During uptrends, volume rises with rising prices and falls during corrections. This is one of Dow theory’s basic tenets, as expressed by Robert Edwards and John Magee: “Volume goes with the trend.” Long-term investors tend to accumulate shares gradually, leading to a major shift in the demand/supply outcome toward the demand, which in turn leads to waves of higher lows followed by higher highs. Volume tends to increase upon reaching new price territories and decrease during downward corrections. The VZO will react to that behavior by staying in the upper zone between zero and +40, indicating more buying pressure than selling pressure.
Suggested Books and Courses About Trading With Indicators


UPTREND SYSTEM RULES
When the ADX is above 18, the action is considered to be trending. The price crossing the 60-day EMA determines whether the trend is bullish (above the EMA) or bearish (below the EMA). When the ADX is below 18, the action is considered to be sideways, regardless of whether price is above or below the EMA. When price is above the 60-day EMA and ADX is greater than 18, buying signals are issued when:
- The VZO crosses from below -40 to above -40 (over-sold reversal)
- A retracement down from +40 that fails to reach -40 is common during an uptrend. VZO will not reach the lower boundary and will rebound from a low above -40. Thus, crossing from below zero to above generates a buy signal. To reduce whipsaws, you can wait for a crossing from below zero to above +15.
Three selling conditions occur during a long position when:
- The VZO rises above +60 and starts to go down
- A negative divergence appears at an extreme level and VZO breaks below +40
- Price goes below the 60-day EMA and VZO falls below zero.
DOWNTREND PSYCHOLOGY
During downtrends, volume rises with falling prices and falls during upward corrections. Long-term investors tend to lay off their shares gradually, leading to a major shift in the demand/supply outcome toward the supply, which in turn leads to waves of lower highs followed by lower lows. The VZO will react to that volume behavior by staying in the lower zone between -40 and zero, indicating more selling pressure than buying pressure.
DOWNTREND SYSTEM RULES
When price is below the 60-day EMA and ADX is greater than 18, sell short signals are issued when:
- The VZO crosses from above +40 to below +40 (over-bought reversal)
- A retracement up from -40 that fails to reach +40 is common during a downtrend. VZO will not reach the upper boundary and will fall lower from a high below +40. Thus, crossing from above zero to below zero generates a sell short signal. To reduce whipsaws, you can wait for a crossing from above zero to below -5
There are three covering/closing conditions during a short position when:
- The VZO falls below -60 and starts to go up
- A positive divergence appears at extreme levels and VZO breaks above -40
- Price goes above the 60-day EMA and VZO rises above zero.
With this information, now review the SPY with VZO in Figure 3, but annotated with buy and sell information. Back in mid-February 2010, when the ADX was greater than 18, SPY rose back above its 60-day EMA while the VZO crossed up and down through the zero line.
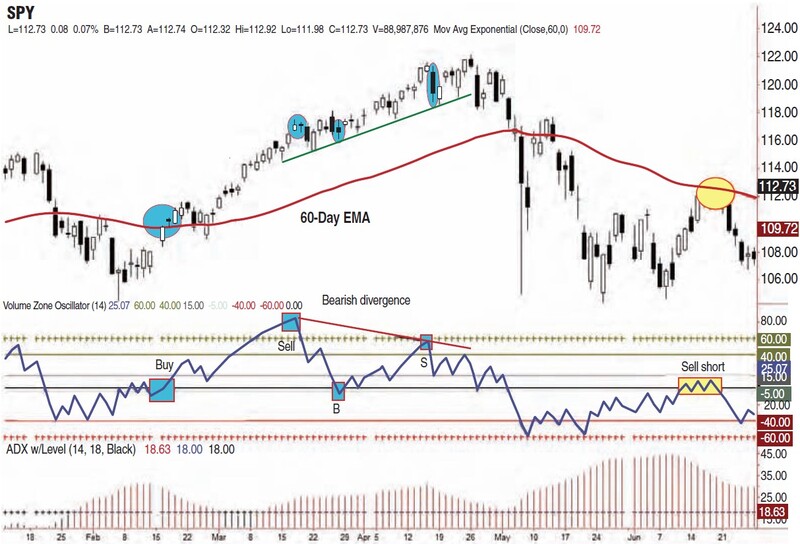
The price closing above the EMA on February 17 (far left, blue ellipse) was accompanied by the VZO closing at 7.80 (blue rectangle, labeled buy), its highest close since January 19. This position would have remained long until March 18 when the VZO closed well above +60 and then fell lower (second blue ellipse and second blue rectangle, labeled sell).
The next buying opportunity came on March 29. SPY was trading above its 60-day EMA (third blue ellipse) and the VZO fell below and then rose back above zero (third blue rectangle, labeled B). This trade was also profitable, exiting on April 16 when the VZO clearly made a bearish divergence with price (note the rising price trendline and the falling VZO trendline) and after rising above +40, closed below +40 (fourth blue ellipse and fourth blue rectangle, labeled S).
A few days later came the flash crash on May 6 that sent SPY below its 60-day EMA. Time to watch the short side! The VZO rose above -40 and chopped around for a week in late May to early June. The sell short signal came on June 11 and the following few days (yellow rectangle, labeled sell short), when with price still below its 60-day EMA (yellow ellipse), the VZO start crossing up and down through zero. Figures 2 and 3 explained how VZO is used in trending conditions, when the ADX is greater than 18. Figures 4 and 5 display the VZO action in nontrending conditions when the ADX is less than 18. Take a look at Figure 4.
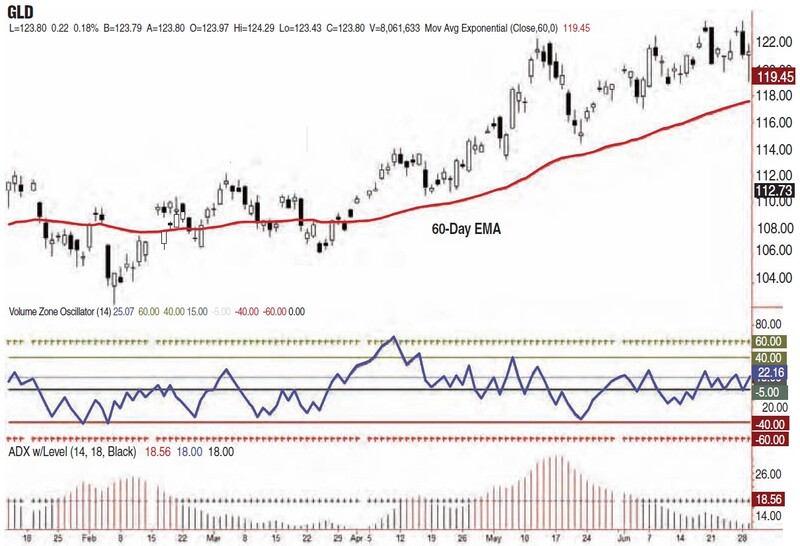
NONTRENDING (OSCILLATING) PSYCHOLOGY
In nontrending periods, the demand/supply outcome is neutral, with periods of buying followed by periods of selling. The VZO usually reacts to this volume behavior by fluctuating between -40 and +40, indicating a balance between buyers and sellers. If VZO reaches the zone between -40 and -60, it means that sellers are finishing offloading their shares, which increases the likelihood of buyers stepping in. If VZO reaches the zone between +40 and +60, it means that buyers are finishing up accumulating their shares, which increases the likelihood of sellers stepping in.
NONTRENDING (OSCILLATING) SYSTEM RULES
Nontrending conditions exist when the ADX is less than 18. When the ADX is below 18, it appears as black crosses. When that is the case, the relationship between price and the 60-day EMA is ignored. VZO rarely reaches +60 or -60 when ADX is less than 18. When the ADX is less than 18, buying signals are issued when:
- The VZO crosses up from below -40 to above -40
- The VZO crosses from below +15 to above +15.
Two selling conditions occur during a long position if:
- The VZO rises above +40, use the sell rules from when ADX is greater than 18
- The VZO never rises to +40, sell when it closes below -5.
If the ADX is less than 18, sell short signals are issued when:
- The VZO crosses up from above +40 to below +40
- The VZO crosses from above -5 to below -5.
Two covering/close conditions can be found during a short position if:
- The VZO falls below -40, use the close/cover rules from when ADX is greater than 18
- The VZO never falls to -40, cover/close when it closes from below +15 to above +15.
Now look at the GLD chart with annotations in Figure 5. On March 3, 2010, the VZO rose above +15 when the ADX was well below 18. That was the first buy signal (first yellow rectangle, labeled buy). The VZO fell below -5 on March 8 (blue rectangle) so the trade would have been sold for a loss of 1.56% before transaction costs.
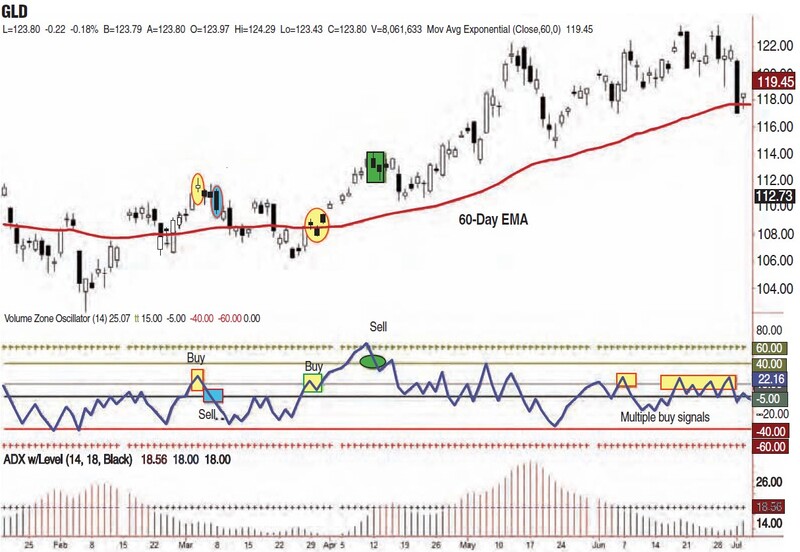
The VZO issued another buy signal on March 29, 2010 (second yellow rectangle, labeled buy); ignore the relationship between price and the EMA when ADX is less than 18. GLD rallied, and by April 9, the VZO was above +60. On April 12, the VZO fell below +60 (green ellipse), so even though the ADX is below 18 (it was 17.46), follow the sell rules for when ADX is greater than 18 and sell on the close.
This second trade would have been sold for a 3.9% gain before transaction costs. These trades assume entries and exits at the closing price and are hypothetical, so there’s no guarantee they would work this way in the future. Note the VZO strategy does not incorporate a stop-loss methodology. Some technicians avoid using a stop-loss when swing trading, on the grounds that it hurts more than it helps. These technicians exit a long position when their strategy issues a sell signal, and they manage risk by adjusting their position size. Other technicians will not enter any trade without a stop-loss. There are pros and cons to both sides of the argument, so you have to make that decision yourself.
There were numerous buy signals on GLD after June 7, when ADX once again fell below 18 and the VZO rose above 15. Sell signals (not shown) occurred when the VZO closed below -5.
SWINGING WITH THE VZO
Conservative swing traders might want to see the VZO fall to -40 or rise above +40 before buying or shorting when the ADX is below 18. The risk is that by the time the VZO rises or falls to those levels, the ADX will probably be above 18 so you would need to monitor the relationship between price and the EMA before taking a directional trade.
Another possibility when the ADX is below 18 is to buy or write option straddles or strangles. A low ADX means volatility is low. These neutral option strategies are used when you believe the underlying security is stable and you don’t think it is going to make a large price move. An ADX move above 18 would be a signal to consider exiting the straddle or strangle. In Next Article, we will introduce a similar, complementary indicator: the price zone oscillator (PZO).
Walid Khalil, CFTe, MFTA, is a member of the International Federation of Technical Analysts (IFTA) and chief technical strategist at Premiere Securities, Cairo, Egypt. He teaches technical analysis at the Egyptian Society of Technical Analysts (ESTA).
David Steckler, JD, is an investment advisor with Global Investment Solutions, and is a past president of the American Association of Professional Technical Analysts (AAPTA). He is a member of IFTA.