Trading Articles
How I Stopped Holding And Learned To Love The Death Cross By Greg Gazurian

Check out this exit strategy, which may be what you need when a specific stock or market is weakening or bearish, compared to the (classic but not necessarily desirable) buy & hold strategy. Traditionally, buy & hold investors have sought to buy low and sell high to maximize returns. Although this sounds attractive, there are several problems in using only this approach in the stock market. One of the most common is the round trip, where the invetor buys the stock at a relatively low price, holds the stock as it goes up, continues to hold as the stock loses the gains, until it returns to the price at which it was bought.
Unfortunately, many investors have found themselves holding after the gains disappear and losses continue, hoping the stock will make a comeback. Some buy even more, regardless of the losses they are still holding, in a feeble attempt to offset the losses by buying when it’s inexpensive. This type of averaging down happens when emotions overtake logic, and it is usually for the worst.
BUY & HOLD APPROACH
Look at how the buy & hold investor begins to invest in the market. First, the investor must determine the current value of the stock. Fundamental analysis of a stock is the most commonly used method to gauge market value. One of the prerequisites for fundamental analysis is that the accounting data or financial outlook that the company provides is accurate and a reflection of the company’s business status for that reporting period.
But what is the individual investor to do when the fundamental picture the company presents is untrue?How can an individual invest in a company he has concluded to be a good buy and still protect his investment from potentially inaccurate, misleading information? Is there any way for an investor to hedge against unforeseen circumstances that will negatively affect the market or stock that is part of his buy & hold investment strategy?
Implied volatility, or the estimated volatility of a securities price, sharply increased in early 2007. In fact, February 27, 2007, was the largest single-day percentage increase in the history of the CBOE vola-tility index (VIX). The uncertainty in the markets and perspectives regarding them make gauging the markets’ directions difficult at best. Wild swings in today’s markets make for many round trips or worse for the buy & hold investor.
TECHNICAL ANALYSIS
One such example of the changing times is the housing market. Three years ago, the housing market was so hot that every Joe Schmo was getting a second mortgage as an investment. Now, the housing market is another bubble gone bust as the global credit crisis continues to unfold. Hedge funds and major financial institutions have lost out, trying to play the subprime mortgage market shell game. How could an individual investor with no inside information and limited resources possibly have protected his credit crisis–related investments?
Technical analysis can show insight into stock price behavior not reflected in fundamental analysis. Research has shown that stock price patterns can provide information that may be useful to an investor. Based on the historical price movements of a stock or other financial instrument, technical analysis requires no emotions or interpretation of events. Once a technical parameter is determined, a trade is triggered when the predetermined trade criteria has been met. Strategies based on technical analysis can provide automated trade execution. Backtesting, or the simulation testing of your technical strategy over a period of time, is the best way to compare performance of different strategies against the market or specific stocks.
Humans usually figure out which technical indicators work best and which criteria are optimal for a specific security or market, so this fine-tuning process can be time-consuming. Although past performance does not guarantee future return, certain technical strategies continue to show their advantage over buy & hold.
INCREASED PERFORMANCE?
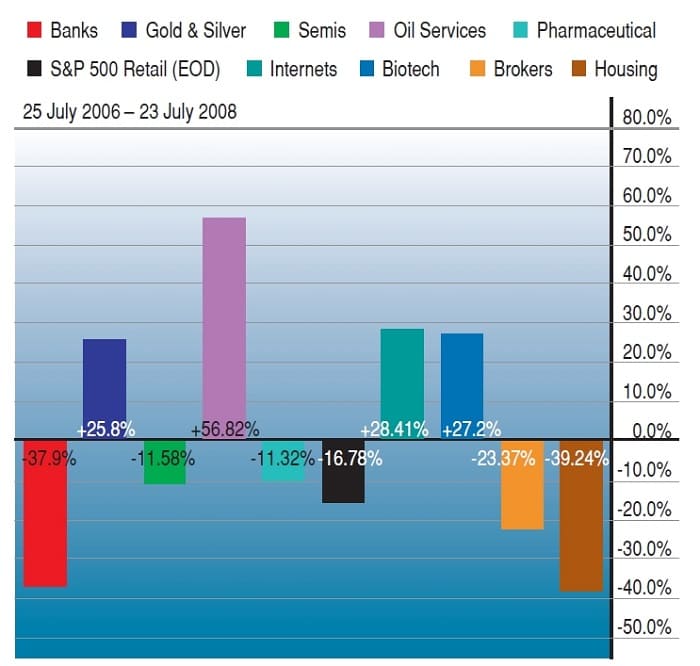
Can an automated technical strategy prove that it increased performance and reduced risk, and warned when to exit a long position before a round trip? Specifically, I wanted to see how a strategy utilizing technical analysis might have benefited an investment made in the worst industry and sectors (housing, financial, and consumer discretionary) before and during the credit crisis compared to a pure buy & hold strategy. Some top industry and sector investments (energy, gold, and tech) are included to test bull market effectiveness as well (Figure 1).
Backtesting on StreetSmart Pro was utilized about a two-year period, which was 503 days (July 25, 2006, to July 23, 2008). Settings were day periods, default Sharpe ratio risk-free rate of 1.5% and $9.95 commission per trade. Initial equity was $10,000 and the trade size was $5,000 per trade. This prevented the cash balance from going negative (that is, short sell borrowing–induced debt) and to maximize profitability of trades.
Suggested Books and Courses About Investment
Technical indicators are calculated using close-of-day prices, so trades are triggered to execute for the next-day open. Two different strategies were backtested against these symbols:$SPX, SPY, DIA, QQQQ, $HGX, XLF, XLY, XHB, HOV, FRE, FNM, BAC, C, CIT, LEH, JPM, USO, GLD, POT, MA, FSLR, and RIMM. These strategies worked thus:
Strategy 1 utilized three technical indicators to trigger trade actions for entering and exiting long and short equity positions.
- The first indicator is a (10-, 50-day) simple moving average (SMA) cross. When the 10-day SMA moves above the 50-day SMA, a long position enters and/or a short position exits.
- The second indicator is a (12-, 26-day) moving average convergence/divergence (MACD) and (12-, 26-, 15-day) signal line cross. The MACD is the default 12-day exponential moving average (EMA) subtracted by the 26-day EMA. The signal line is typically a nine-day EMA of the MACD. I increased the period to 15 to create a less-frequent trigger that minimizes whipsaws created by volatile markets. When the (12-, 26-day) MACD moves above the (12-, 26-, 15-day) signal line, a long position exits/short position enters.
- The third indicator is a (14-, 14-, one-, 0.75-, 0.25-day) stochastic relative strength index (RSI) level cross. De-fault 14-day periods are used for the stochastic and RSI calculations with a slowing period of one. The stochastic RSI represents the percentage change from the previous 14-day range RSI to the present. Only moves falling below 0.75 (75%) trigger a long position entry.
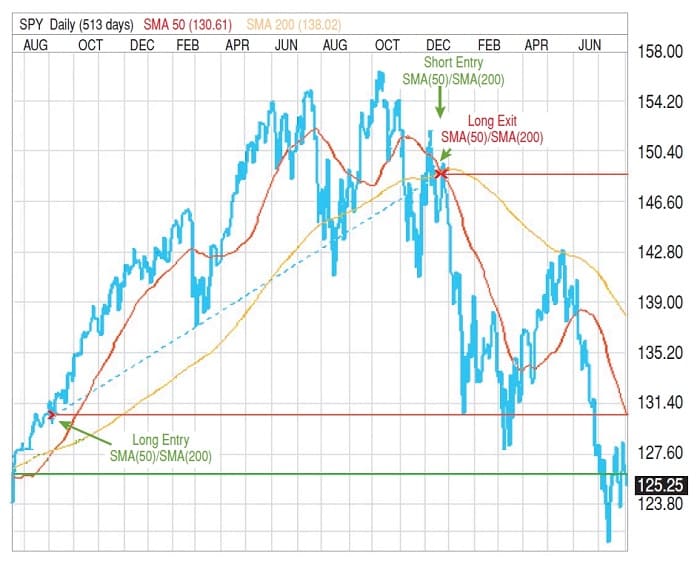
Strategy 2 is one of the most basic, since it utilizes just one technical indicator to trigger trade executions. The indicator is a (50-, 200-day) SMA cross. When the 50-day SMA moves above the 200-day, a new long position opens and any short is closed. Inversely, when the 50-day SMA moves below the 200-day, a new short position opens and any long is closed. Institutional traders know the former as a death cross and the latter a golden cross.
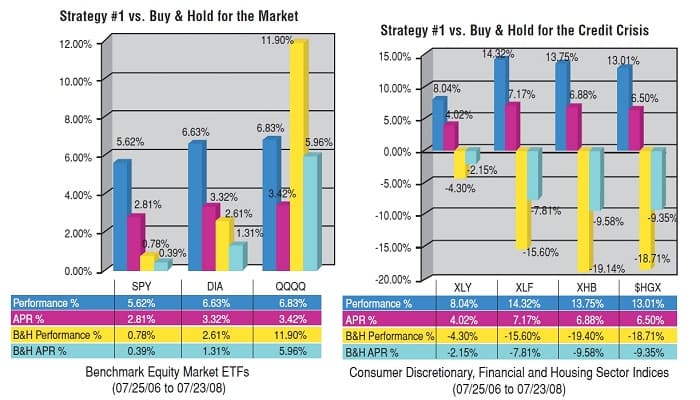
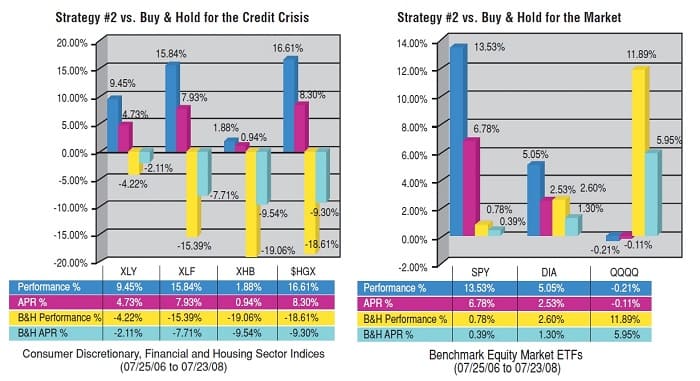
Strategy 1 (Figure 2) shows it beat buy & hold for both the credit crisis stocks, up 12.28%, and the market benchmarks, up 6.36% for an average total performance gain. Buy & hold was down -14.44% and up 5.1%, respectively. The QQQQ was the only instrument buy & hold outperformed vs. both strategies. Strategy 2 also beat out buy & holds for both situations (Figure 3), with up 10.95% against the credit crisis stocks and 6.12%for the market, while buy & hold was down -14.32% and up 5.09%, respectively.
PERFORMANCE RESULTS
Earliest trade dates for strategies using technical analysis show how effective strategies are for anticipating bear and bull market conditions. The parameter for the earliest trade consists of a profitable trade held for at least two months. This trade should also be consistent with the beginning or end of a bear or bull market.
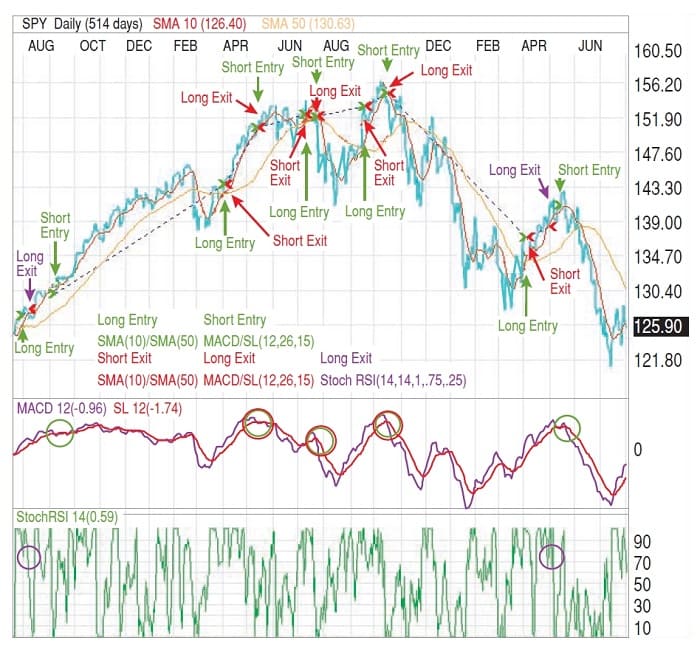
Strategy 1’s earliest short entry date for the SPY bear market was October 17, 2007, at $154.25 (Figure 4). This trade exited almost six months later on April 4, 2008, at 136.89 for an 11.25% gain in closed profit. Had an investor used buy & hold, he would be around the breakeven or round-trip point. There were no long position entries for strategy 1 that qualified as bull market indicators for SPY or any of the equity instruments backtested.
With the death cross, the investor has an unbiased way to determine when a stock is weakening or bearish.
Strategy 2’s earliest short entry date for the SPY bear market was December 24, 2007, at $148.82 (Figure 5). This trade was still open seven months later for a 14.11% gain in open profit. The earliest long entry date for the SPY was September 12, 2006, at $130.56 and held for about 15 and a half months. Before the long entry breakeven point (first red line) first reached on January 18, 2008, the long position exited for an 11.75% gain in closed profit and entered the short position (second red line, short entry breakeven point). The $125.98 breakeven point (green line) for buy & hold on July 25, 2006, now seems to serve as a support and resistance level for SPY.
Only strategy 2 offered long entries into these tradables (indexes and stocks): SPY, QQQQ, GLD, USO, POT, and RIMM. Of those entries, all but SPY and QQQQ are still open for an average open position gain of 120.98%. The buy & hold open position average gain for those four stocks is 139.73%. Even more, the buy & hold strategy made its greatest open position gain of 477.38% from FSLR and third greatest of 247.4% from MA, both which were the only stocks not to trigger a trade by strategy 2. Since both stocks were initial public offerings (IPOs) in 2006, there is not as much price data for the SMA periods to be useful for long entry points.
FSLR started trading November 2006; the 200-day SMA did not plot on the chart until September 2007. MA started trading May 2006; the 200-day SMA for MA begins in March 2007. If shorter SMA periods are used, then there is a greater likelihood of a long entry trade execution. Adding a (20-, 50-day) SMA crossover strategy for stocks with a shorter trading history, as another way to enter a long position, would have allowed open long positions up 125.85% for FSLR and 148.85% for MA.
HOLDING ’EM
The main advantage of the buy & hold strategy is also its greatest weakness. Although a stock held during weakness is not a loss unless it is sold, there is no way of knowing if or when a stock will recover from the weakness. Then again, there is no way of knowing when to buy during a period of strength. Falling stock prices might seem like a discount buy time for a value-oriented investor since it lowers the price/earnings ratio, but it may also be a potential short sell candidate due to expectations of lower future earnings growth, and hence the reduced price.
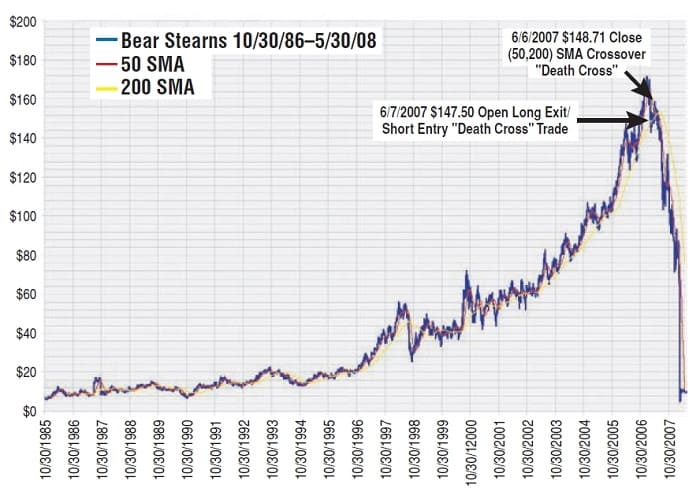
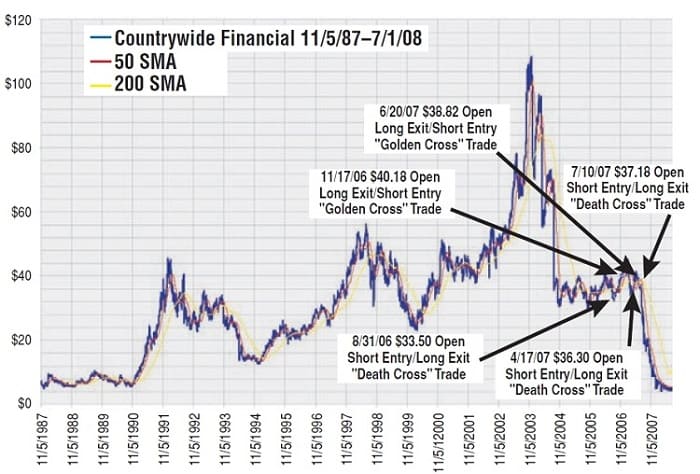
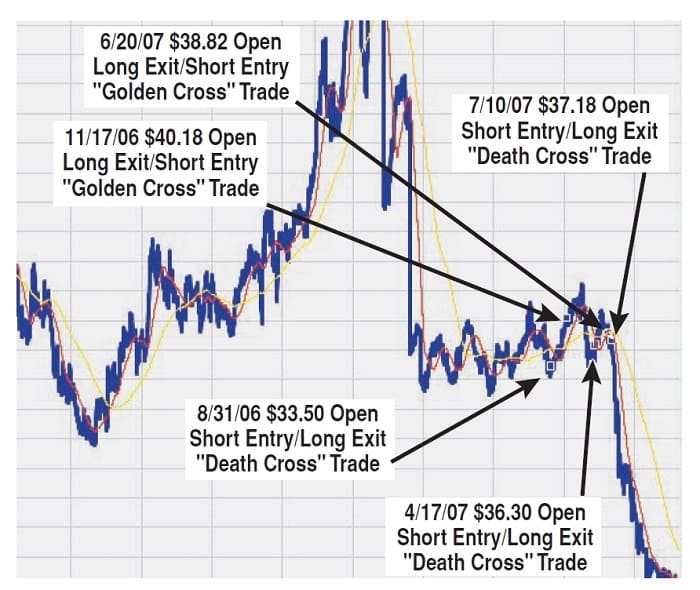
Stocks such as Bear Stearns (BSC) and Countrywide Financial (CFC) are examples of what goes down might never come back up. Bear Stearns, which was founded in 1923, was one of the largest global investment banks and survived the Great Depression and many recessions. Countrywide Financial was the nation’s largest mortgage lender, founded in 1969 and traded on the NYSE since 1985. BSC was at an all-time high of $171.51 on January 12, 2007 (Figure 6), and CFC was at a four-year high of $45.03 on February 2, 2007 (Figure 7), before both hit all-time lows and stopped trading 15 to 16 months later at $9.33 on May 30, 2008, for BSC and $4.25 on July 1, 2008, for CFC. Buyouts rescued both companies so shares of each did not go to zero. JP Morgan (JPM) originally offered BSC shareholders $2 a share, then $10, and Bank of America (BAC) offered CFC shareholders 0.1822 shares of BAC for every one of CFC. See Figure 8 for examples of the golden cross and death cross trades. Buy & hold is unforgiving; it is an all-or-nothing bet.
A high-performance stock whose price goes up and never down cannot fail with a buy & hold investment, but this is usually the rare exception. With buy & hold, your stock must eventually go higher than the price at which you bought, but there is no guarantee of that. There is not even a buy & hold rule for selling a stock for a loss or profit. At the very least, a technical analysis–based strategy can prevent a loss and lock in a gain (closed profit) of a high-performance stock.
KNOW WHEN TO FOLD
To augment buy & hold for entering long positions with an exit strategy like the death cross, the investor has an unbiased way to determine when a specific stock or market is weakening or bearish. This type of trade would have yielded the 477% and 247% gain of open profits for FSLR and MA that buy & hold achieved, but with the downside protection guaranteed by the death cross. By adding the entry of a short position whenever a long position is exited, an investor can have not only a way to close profits when the stock or market is weak, but hedge against the weakness by the open profit of the short position.
Greg Gazurian has been trading stocks and options since 1998. He is an MTA affiliate and has completed level I of the CMT exam program. He worked more than nine years in IT for SunGard’s Market Data Services and CSA groups. Currently, he is seeking a position as a technical/research analyst.