Trading Articles
High-Volume Breakouts: Price Action and Volume Confirmation
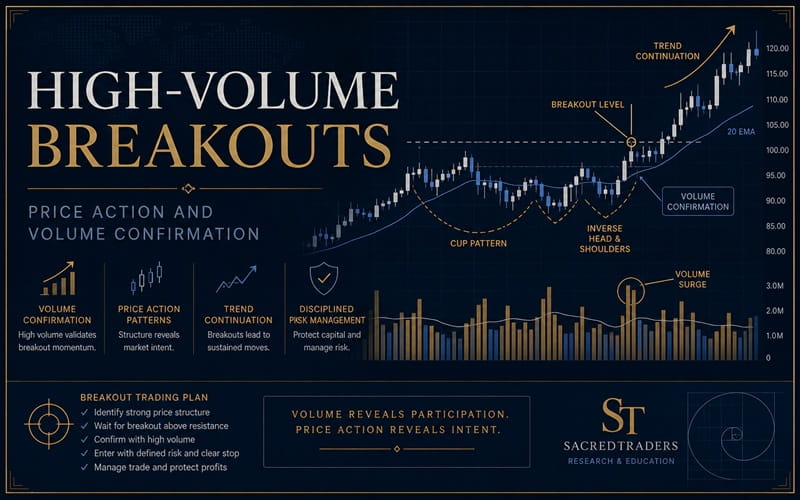
In High-Volume Breakouts article, we are presenting breakout trading strategies from professional daytrader and educator, Ken Calhoun. We will look at the role that volume and price-action breakout patterns play in confirming entry signals. As many traders know, the two most important technical trading signals are price and volume. By combining price-action breakout patterns with specific volume confirmation signals, you can identify strong trading entries as they’re moving to new highs. You can spot high-volume breakouts whenever volume increases significantly—that is, at least 30% higher than their average trading volume—along with a move up in price. These are important because strong volume indicates institutional buying is at work, which can help you find good entries. In this article, I’ll show you how to find high-volume breakout patterns when you’re entering your trades.
A popular Wall Street professional traders’ saying is that “traders vote with volume, and profit with price action.” It’s wise to wait for volume confirmation prior to entering any breakout trade, because you want to have high volume serve as the “wind beneath your wings” to support an upside technical price move whenever you trade. It’s not enough to simply buy new highs for breakout entries. You want price to continue upward after you enter your trade, and seeing strong volume is one of the best ways in which you can achieve this. Here, then, are some high-volume breakout patterns you can look for to help with finding good entries.
Strong volume indicates institutional buying is at work, which can help you find good entries.
High-Volume Breakouts & Cups
The first volume breakout pattern to look for is one in which volume increases steadily near the right side of a bullish cup, as it tests prior resistance. You will often notice an uptrend in the height of volume bars, in addition to an upward sharp move in price. The volume bar uptrend should make a triangle-type pattern, with the highest volume bars on the right side.
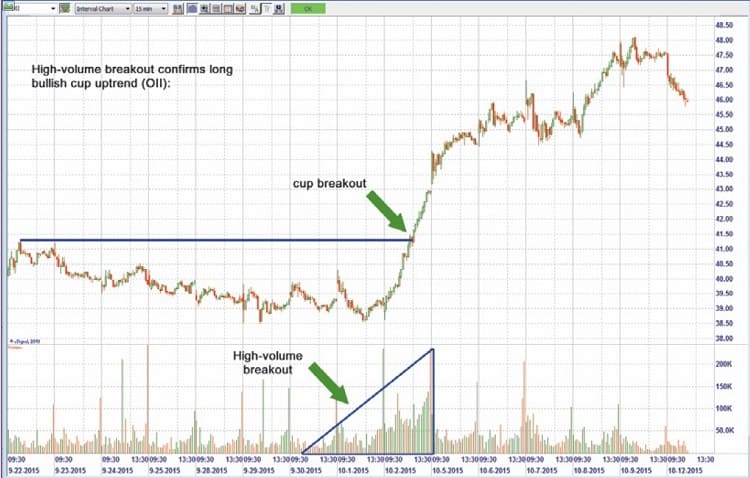
You can see this pattern illustrated in the chart of Oceaneering International, Inc. (OII) in Figure 1, in which the cup breakout is confirmed by a high-volume breakout on October 2, 2015. The volume trended up heavily during this triangle breakout pattern. When you’re scanning for these patterns, a good entry strategy is to enter a new swing trade anywhere from 50 cents to a dollar above the high of the breakout pattern day on a subsequent day (in this case, an entry near $44 on October 5, 2015).
Advanced Books and Courses on Price Action Trading


You may often come across these high-volume breakout patterns after they’ve made their initial move. The good news is that entering above new highs on a day following this pattern is fine, as long as it has remained in an uptrend following the initial volume breakout day, as seen on the chart in Figure 1. A simple criterion for confirming a new breakout entry is to determine if volume and price are both at 15-day highs. If price alone is at a 15-day high, you may still wish to take the trade, but to be cautious, you should trade a smaller share size. If price and volume are at 15-day highs, then you can trade a larger size.
This is an effective guideline for helping to decide how many shares to trade; you can also use volume bar height to help you visually see if your trade size should be small versus large, based on overall trading volume. If current volume for the chart you’re considering is unchanged during an uptrend, then you trade a small size. If, however, current (most recent) volume is at least 30% higher than average, in an uptrend or other breakout pattern, then you can consider trading a larger size.
Volume Gap Continuations
The most common high-volume day is one in which price has gapped up (or down), as seen on the chart of EMC Corp. (EMC) in Figure 2. These minor gaps of less than one to two points will often continue in the direction of the gap, often for several days. When you see a high-volume gap continuation pattern like this, it’s a smart trading idea to figure out how to enter your trade during the two to three days following the gap day.
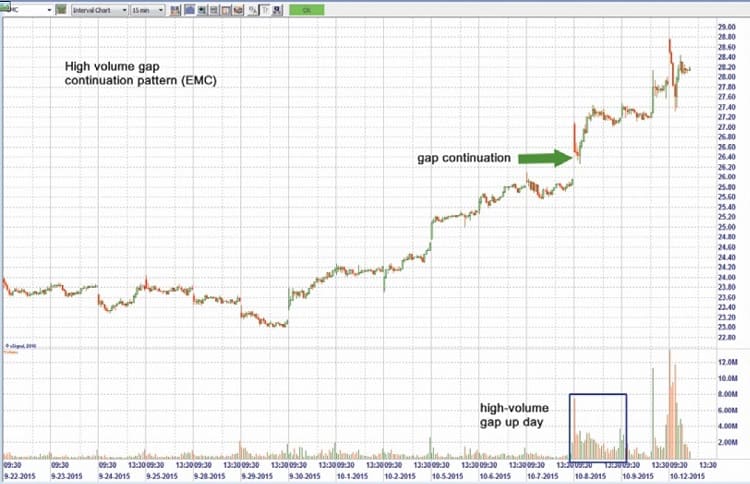
You will likely find that these patterns make for a primary trading strategy, since high-volume gap continuations tend to work out well. Your initial, as well as second or third, scaled-in trades can also use volume confirmation signals to help you decide when to add to a winning position. In Figure 2, you can see that October 12, 2015, on the rightmost side of the chart, was also a high-volume day. Entering on a later day, above the high of this volume breakout day, would also make sense.
When you trade high-volume gap continuations, it’s important to note that the best ones are in a clearly defined, strong, sustained uptrend. Similar to visiting your eye doctor and reporting which letters are the clearest, in trading, it’s important to avoid up-and-down choppy charts, even if they have high-volume breakouts. Give preference instead to charts that exhibit price action in a tight, narrow, strongly up-trending channel like those discussed here.
Inverse Head & Shoulders Breakout
Another strong pattern for day or swing trading is to enter a long trade following an inverse head & shoulder (H&S) pattern (series of three bullish cups) on high volume. You can see how strongly this pattern works on the chart of Weight Watchers International, Inc. (WTW) in Figure 3. The multiple retest of resistance near $15/share finally broke out to new highs, once volume increased right after 9:30 am.
Note how much higher the overall volume bars are on October 20, 2015 compared to the prior day, during the inverse H&S breakout during the opening hour of the trading day. One interesting point to note on this chart is how the prior day’s range ($15 – $11 = $4) was met early in the day, as WTW moved four points during the early part of the day due to high-volume buying on the open. When you are looking for what’s worth trading, charts with volume and volatility (the “two Vs”) like this one are usually the best candidates.
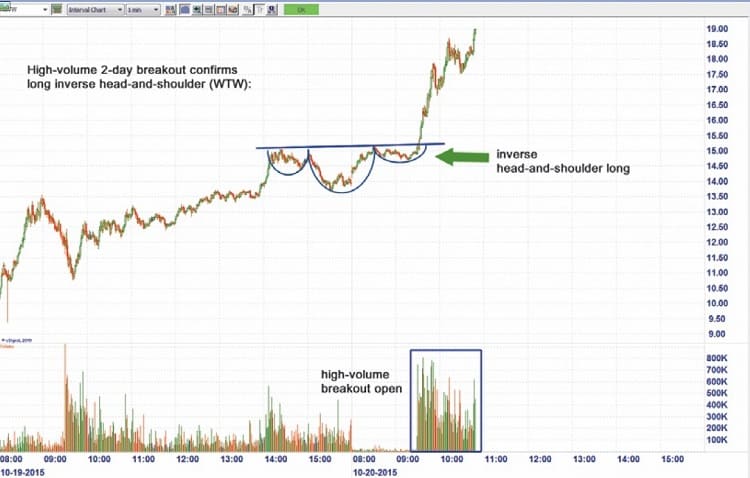
Here are two quick technical points to keep in mind when entering long inverse H&S breakouts: first, it’s best if the neckline is in a slight uptrend (as it is in Figure 3); second, it’s best if the depth of the rightmost cup is less than $1, as in this example. This compression pattern—one with shallow cups—in an H&S breakout often leads to solid upside moves. In this example, it did a full three-point upside breakout.
From a timing standpoint, when you see these types of upside high-volume breakouts, a nice feature is that they’re so strong you don’t have to enter early or “right on time” above the neckline. They will often move a dollar or more before a pullback, making them ideal for both intraday as well as swing trading.
High Volume Above 50-Period Moving Average
For longer-term swing trading, you can use a 90-day daily candlestick chart with the 50/100/200-period simple moving average (SMA) lines that are favored by institutional traders. One high-volume breakout pattern that capitalizes on 50-period SMA breakouts is illustrated in the chart of Best Buy Co. Inc. (BBY) in Figure 4. A long entry is initiated following a day in which price action trades above the 50-period SMA on strong volume.
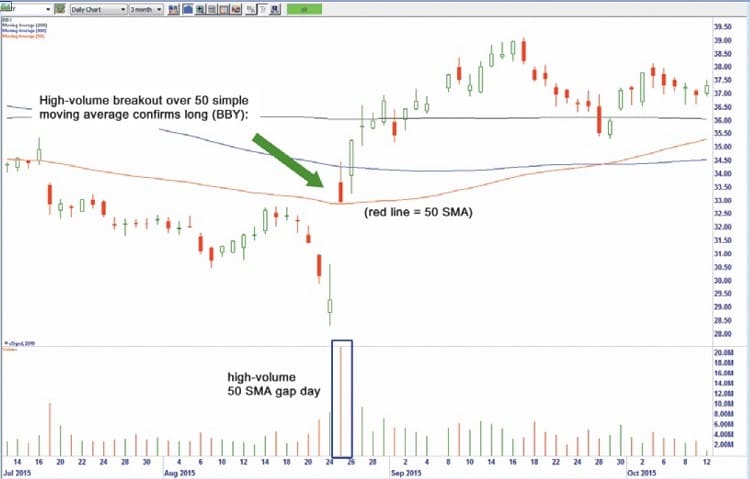
The 50-period SMA on a 90-day daily chart is a key technical indicator that, when combined with volume, can help you spot strong breakouts as they progress in an uptrend. You can see that this pattern trended up for three weeks before pulling back, going from $33/share to $39/share. Your initial exit target can be set at the 200-period SMA (in this chart, that’s the black line at $36); this one kept going up strongly even after that exit target was hit.
The reason this high-volume 50-period SMA breakout pattern works is simply because professional traders use this technical moving average value to make their entry decisions. The strong buying volume that comes in after a move above the 50-period SMA attracts additional buying momentum, which leads to the multiday breakout continuation.
Your Breakout Trading Plan
Think of the supply & demand involved in trading; when volume is high and price continues in an uptrend, it’s because there’s not enough share supply at one price point, so price increases. As long as price and volume both continue increasing in an uptrend, the breakout continues. If you see volume drop and price move sideways in a consolidation, or start to drop, it’s time for you to tighten your trailing stop or exit the trade altogether. Here are some trading tips to keep in mind:
- Use high volume as a disciplined trading guideline; do not take trades until strong volume (>30% higher than usual) starts to show up on your charts.
- l High-volume breakouts will usually trend for much longer than average-volume breakouts. Capitalize on this phenomenon by planning to scale in and add to winning trades as they continue in your favor (in swing trading, you may wish to add additional shares every two points or so).
- l Selectively trade only the strongest-trending charts in sustained uptrends; for swing trades, the prior trend should have at least three to five days of continuous new highs on your chart prior to entering.
Keep the relationship between price action and volume firmly in mind when you place your trades. See if you can spot similar high-volume breakout charts when you scan through your charts to help identify successful trading entries.
- Ken Calhoun is a producer of trading courses, live seminars, and video-based training systems for active traders. He is a UCLA alumnus and is the founder of TradeMastery.com, an educational resource site for day and swing traders.