Trading Articles
Downside Exhaustion Gap Trading Strategy and Backtest
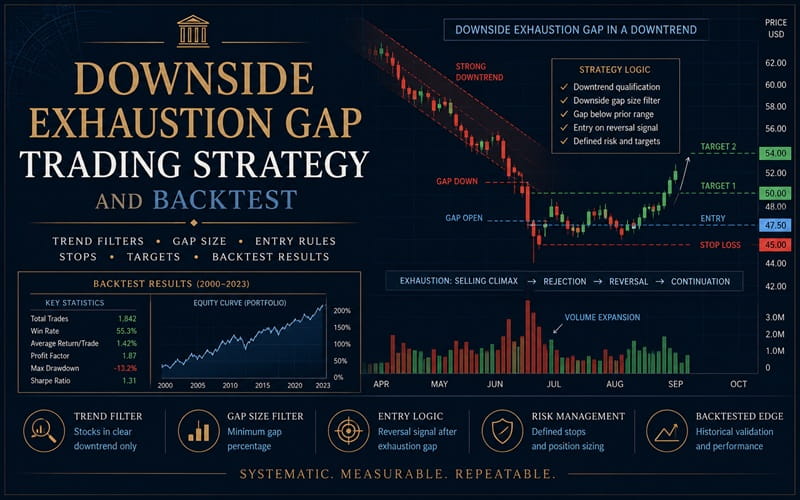
Do exhaustion gaps really fade? Here’s a study that creates and tests an exhaustion gap prediction technique using two measurable factors: stock trend and gap size. A price gap is a price range in which no trading takes place. An upside price gap occurs when today’s price range is above yesterday’s high price. A downside price gap occurs when today’s price range is below yesterday’s low price. It is easy to spot price gaps on bar charts. According to the statistics from this study, the typical US stock generates 18 price gaps on average, annually. The average gap sizes are 1.62% for upside gaps and 1.72% for downside gaps.
What Do Gaps Imply?
From a technical analysis perspective, one of the scenarios for a price gap is that the stock has gone too far and too fast to sustain price momentum. As a result, it would reverse its course of action and begin to move in the opposite direction after the gap. Price gaps associated with this type of situation are called exhaustion gaps. Exhaustion gaps, like runaway gaps, imply rapid, extensive advances or declines which are often wide. In other words, a wide price gap after an extensive price movement in the same direction is considered a potential exhaustion gap.
Based on the descriptions, this study attempts to create and test an exhaustion gap prediction technique consisting of two measureable factors — stock trend and gap size. From a trading strategy development point of view, the opportunity presented by an exhaustion gap is to trade in the opposite direction after the gap. This study also intends to test a price gap trading strategy that trades predicted downside exhaustion gaps. Predicted downside exhaustion gaps refer to the price gaps that are selected using the gap prediction technique. In this article, I’ll detail the technique and its application process. I’ll also introduce the price gap trading strategy and show you the backtesting results.
Downside Exhaustion Gaps
This study only analyzes downside exhaustion gaps and a downside exhaustion gap trading strategy. Since I am looking for downside exhaustion gaps, the two factors in the gap-prediction technique are stock downtrends and downside gap size. In terms of definition, a downtrend is when prices move downward for more than 20% and an uptrend is when prices move upward for more than 20%. This definition is practically identical to “appreciation or depreciation in value of more than 20%” which you find in the Dow Theory.
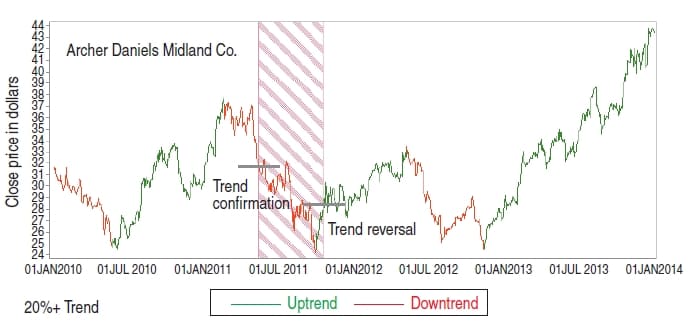
A stock that is in a downtrend qualifies for a downside exhaustion gap. The chart of Archer Daniels Midland Co. (ADM) in Figure 1 shows some uptrends and down-trends. The trends are isolated based on the definition of trends. As defined, a downtrend is recognized when a stock declines at least 20% in price. The area shaded in red on the chart identifies a downtrend that was recognized at the level marked trend confirmation (left horizontal gray line). The stock declined 20% from the prior uptrend high to the gray line. The gray line marked trend reversal on the right indicates that the stock advanced 20% from the downtrend low. The downtrend ended at that point. During the time the stock was in the red shaded zone, it was considered to be in a downtrend. Downside price gaps that occur during such downtrends are considered to be potential exhaustion gaps for further evaluation.
For the purposes of this article, a downside gap size is the width of a downside gap or the vertical distance between yesterday’s low price and today’s open price in percentage. When a downside price gap occurs within a stock downtrend and its gap size is greater than the stock’s average gap size, it is considered to be a predicted downside exhaustion gap. The green shaded range in Figure 2 is considered a predicted downside exhaustion gap since the gap occurs in a downtrend (the vertical yellow bar is the trend measure) and the gap size is wider than its average gap size.
The Trading Strategy
Now that you know how to identify a predicted downside exhaustion gap, I’ll now move on to developing a trading strategy for the predicted downside exhaustion gap. I define a trading strategy as a set of methods (algorithms or techniques) that can be independently and repeatedly used in trading operations. This price gap trading strategy was designed to take long trades after predicted downside exhaustion gaps and complete the trades within 10 days (10-day trading period in Figure 2) after the gaps. The strategy consists of entry, target, and stop price levels computed based on the typical price range of 10-day trading period of individual stocks. In Figure 2, the gray shaded area covers the price range that is divided by a horizontal red line. This red line represents the level of the gap-open (open price of the gap day). The portion above the red line is called upper range and the portion below is called lower range. The entry and stop prices are calculated based on the typical lower range and the target price is computed based on the typical upper range of the stock. Here are the formulas (rules).
- Entry = First available price between red line and stop (except open below stop)
- Stop = Size of typical lower range below red line × 1.5
- Target = Size of average typical upper range above red line
From the chart of AuRico Gold in Figure 2 you can see that the stock price carried an average gap size of 2.22%, the typical upper range of 6.24%, and the typical lower range of 14.41%. Note that AuRico Gold was acquired by Alamos Gold in July 2015. In this example, the red line level was $6.07 so the calculated stop level is $4.76 ($6.07–$6.07×14.41%×1.5).
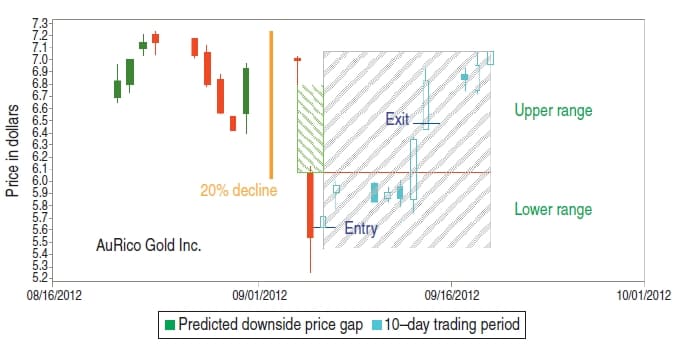
The entry price would be the first available price between $4.76 and $6.07 in the first five days of 10 day trading period. The target was computed as $6.45 ($6.07+$6.07×6.24%). As you can see on the chart, the entry took place on the first day of the 10-day trading period at the open of $5.62. The trade completed when the exit occurred on the seventh day at the target of $6.45.
Next, I need to figure out if this strategy also works on other predicted downside price gaps in this stock and with other stocks. To determine this, it’s necessary to do a full-scale backtest. I collected 1,816 NYSE and NASDAQ listed stocks in random order with a data range covering a 10-year period from September 1, 2004 to September 1, 2014. I used a custom-designed software system — I’ll refer to it as the software — to implement tasks such as isolating stock trends, filtering price gaps, analyzing upper and lower ranges, computing trading price, generating trades for predicted downside price gaps of the stocks, and summarizing the backtesting results. There are a few more trading rules to add.
- Entry is only allowed if there is no holding.
- If no entry occurs in the first five days of 10-day trading period, I withdraw the trade.
- After the entry, if the stock stays between the target and stop to the end of 10-day trading period, the software sells the stock at the close price of the 10th day.
- No exit is allowed on the entry day.
Advanced Books and Courses on Price Action Trading

In the backtesting, the software generated 36,872 trades for the strategy on the 1,816 stocks. According to the summary statistics for AuRico Gold, the strategy lost 30.48% on 33 trades over the 10-year period of time under study. Why did the strategy fail to perform on the other gaps of the stock? According to the statistics, it had a typical upper range of 6.24% and lower range of 14.41%. The ratio between upper and lower ranges is 1:2.31. When there is a tendency for a stock to move much lower than higher after the gaps, it is difficult to profit from long trades. This stock did not show any pattern that consistently produced exhaustion gaps similar to the one shown in Figure 2. Fortunately, the statistics indicate that AuRico Gold belongs to a minority, so if the stock is removed from your portfolio, the performance of the strategy could improve.
To prove the assumption, I had the software pick the top 275 (top-275), top 450 (top-450), and top 900 stocks (top- 900) from the range-ratio-sorted list of 1,816 stocks. These stocks had the higher upper/lower range ratios. They were grouped as three separate stock portfolios. AuRico Gold had a low ratio so was not selected. If there is a positive relationship between backtesting returns and the upper/lower range ratio, the assumption that it is difficult to profit from long trades in stocks that move lower than higher after gaps is considered correct.
Test Results
You can see from Figure 3 that the average annual returns from the strategy backtesting are 20.60%, 25.20%, and 30.20% for top-900, top-450, and top- 275 respectively. The per-trade returns are 0.98%, 1.14%, and 1.32%. The winning trade rates are 57.70%, 58.68%, and 59.20% for the respective stock portfolios. Stocks in the top-275 carried the higher upper/lower range ratios than the stocks in the other two portfolios. The portfolio performance from the returns to drawdowns has also topped the other portfolios most of time during the period under study. As expected, the top-450 outperformed the top-900. This confirms the assumption that stocks with higher upper/lower range ratios tend to perform better. Figure 3 also includes cumulative profit/loss statistics for NASDAQ (^IXIC) and NYSE (^NYA).
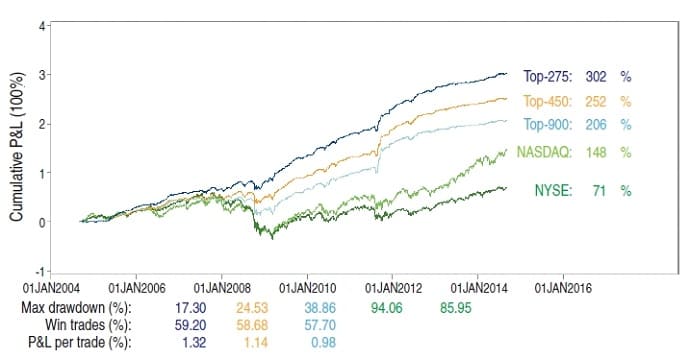
In addition to the stronger returns over time, the strategy appears to produce much smaller drawdown numbers than the indexes. This generally means that the strategy is less risky.
Does It Work?
This price gap trading strategy aims to profit on oversold conditions generated by exhaustion gaps. It tends to produce relatively smoother return curves with lower drawdown rates compared to the indexes. Testing of the strategy suggests the exhaustion gap prediction technique works. Because the strategy involves frequent trading, unlike a buy & hold approach, it requires a much smaller amount of funds to operate. For the top-450 stock portfolio, the average stock count in the back-test was only 29 stocks.
- Kevin Luo is an independent technical analysis researcher who focuses on automated price trend–related analysis and generation of trading strategies. He and his project partners developed an automated trend analysis and back-testing system for high- and low-frequency trading.