Trading Articles
Gann’s Cube: The Hexagon Chart for Time Cycle Analysis
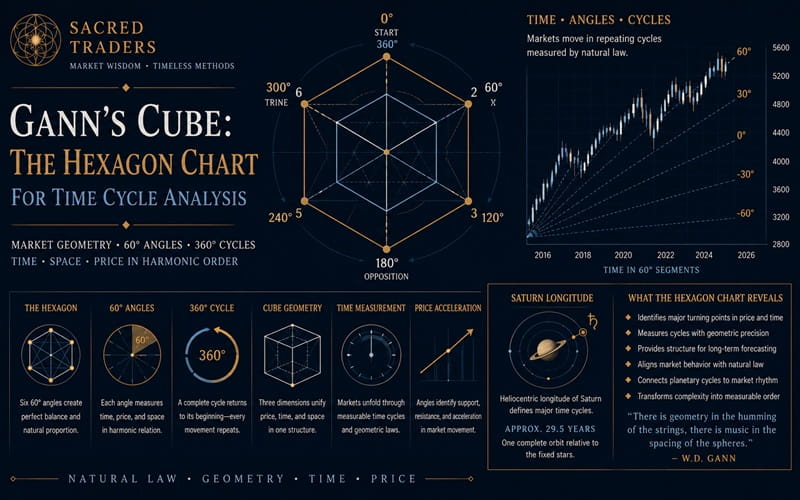
Since everything moves in a circle and nothing moves in straight lines, this chart is to show to you how the angles influence stocks at very low levels and very high levels and why stocks move faster the higher they get, because they have moved out to where the distance between the angles of 45° are so far apart that there is nothing to stop them and their moves are naturally rapid up and down. We begin with a circle of “1”, yet the circle is 360° just the same. We then place a circle of circles around this circle and six circles complete the second circle, making a gain of 6 over the first one, ending the second circle at 7, making 7 on this angle a very important month, year, and week as well as days, the seventh day being sacred and a day of rest. The third circle is completed at 19.
The fourth circle around is completed at 37 – a gain of 18 over the previous circle. The fifth circle is completed at 61, a gain of 24 over the previous circle. The sixth circle is completed at 91, a gain of 30 over the previous circle and the seventh circle at 127, a gain of 36 over the last circle. Note that from the first the gain is 6 each time we go around. In other words, when ‘is’ have traveled six times around we have gained 36. Note that this completes the first Hexagon and as this equals 127 months, shows why some campaigns will run 10 years and seven months, or until they reach a square of the Hexagon, or the important last angle of 45°. The eighth circle around is completed at 169, a gain of 42 over the first. This is a very important angle and an important time factor for more reasons than one. It is 14 years and one month, or double our cycle of 7 years. Important tops and bottoms culminate at this angle, as you will see by going over your charts.
The ninth circle is completed at 217, a gain of 48 over the previous circle. The tenth circle is completed at 271, a gain of 54. Note that 271 is the ninth circle from the first, or is the third 90° angle or 270°, three fourths of a circle, a strong point.. All this is confirmed by the Master Twelve Chart, by the four seasons and by the Square of Nine Chart, and also confirmed by the Hexagon chart., showing that mathematical proof is always exact no matter how many ways or from what directions you figure it.
The eleventh circle is completed at 331, a gain of 60 over the last circle. The twelfth circle is completed at 397, which completes the Hexagon, making a gain in 11 circles of 66 from the beginning. 66 months, or 5 years and six months, marks the culmination of major campaigns in stocks. Note how often they culminate on the 60th month, then have a reaction, and make a second top or bottom in the 66th month. Note the number 66 on the Master Twelve Chart. Note it on the Square of Nine and note that 66 occurs on an angle of 180° on the Hexagon chart, all of which confirms the strong angle at this point. We have an angle of 66°, one of 67.5° and one at 68, confirming this point to be doubly strong for tops and bottoms or space movements up or down.
Note the number 360° on the Hexagon Chart. It completes a circle of 360°. From our beginning point this occurs at an angle of 180° on the Hexagon Chart going around, but measuring from the center, it would equal an angle of 90° or 180°, making this a strong point, hard and difficult to pass, and the ending of one campaign and the beginning of another.
Again with the center of the Hexagon Chart at “1” notice that 7,19,37,61,91,127,169,217,271,331, and 397 are all on this direct angle and are important points in time measurement. Beginning with “1” and following the other angle, note that 2,9,22,41,66,97,134,177,226,281, and 342 are all on a same angle of 90°, or an angle of 60° and 240° as measured by the Hexagon Chart . Go over this Chart and the important angles each way and you will see why the resistance is met either on days, weeks, months or years, and why stocks stop and make tops and bottoms at these strong important points according to time.
When any stock has passed out above 120° or especially above 127° or 127 points and gone out of the square of the first Hexagon, its fluctuations will be more rapid and it will move faster up and down. Notice near the center that in traveling from 66 to 7 you strike the angle of 180° or 90°, but when the stock gets out to 162, it can travel up to 169 before striking another strong angle. That is why fast moves occur up and down as stocks get higher and as they move from a center of time.
Advanced Books and Courses on W.D. Gann Methods


Remember that everything seeks the center of gravity and important tops and bottoms are formed according to centers and measurements of time from a center, base or beginning point, either top or bottom. The angles formed going straight up and across, ‘may a com’ just the same going across as the stock travels over for days, weeks, months or years. Thus, a stock going up to 22.5 would strike an angle of 22.5°. If it moves over 22.5 days it would strike the angle or 22.5 weeks or 22.5 months, it would also strike an angle of 22.5°, and the higher it is when those angles are struck and the angle it hits going up, the greater the resistance to be met. Reverse that rule going down.
Market movements are made just the same as any other thing, which is constructed. It is just the same as constructing a building. First the foundation has to be laid down and then the four walls have to be completed and last, but not least of all, the top has to be put on. The cube or hexagon proves exactly the law, which works because of time and space in the market. When a building is put up it is built according to a square or hexagon. It has four walls or four sides, a bottom and a top; therefore, it is a cube.
In working out the 20- year Cycle in the stock market, the first 60° or 5 years, from the beginning forms the bottom of the cube. The second 60°, running to 120°, completes the first angle or the first side and runs out the 10 year Cycle. The third 60° or the second side ends 15 years or 180°. It is very important because we have the building half completed and must meet the strongest resistance at this point. The fourth 60°, or at the end of 20 years or 240 months, completes the third side. We are now two thirds around the building, a very strong point which culminates and completes our 20-year Cycle. The fifth 60°, or 300° point, days, weeks, or months completes 25 years, a repetition of the first five years, but it completes the fourth side of our building and is a very important angle. The sixth 60°, or 360°, completing the circle and ending 30 years as measured by our Time Factor, which runs 1° per month on an angle of 45°, completes the top. This is a complete cube and we begin over again.
The time factor that moves 1° per month is heliocentric Saturn. Each 60° of longitude takes an average of 5-years to complete. However, because of the elliptical orbits of planets, this time period is not equal to an exact 5 calendar years, which is based upon the Earth’s orbit around the Sun. For example, If you add 180° of longitude to heliocentric Saturn’s position from the August 1982 low is the U.S Stock Market and also add 360° of longitude from the Stock Market top on December 1st, 1968, you arrive at April 22, 1998. If you look at a chart of the market averages from this date you will see that this marked a significant top where the majority of the stock averages dropped 20% or more. If you add 60° of longitude to the 1982 low, you get the crash low of 1987, etc. Some of the other important time periods mentioned in Gann’s description of the Hexagon chart are 20-years, 14-years, 7-years, 45-years and 67½-years.
- 20-years is the synodic period of Jupiter & Saturn, i.e. the planets conjoin every 20-years.
- 14-years is the synodic period of Jupiter & Uranus and also is the average time required for Neptune to change signs or move 30° of longitude.
- 7-years is ½ the synodic period of Jupiter & Uranus and is also the average time required for Uranus to change signs or move 30° of longitude.
- 45-years is the synodic period of Saturn & Uranus.
- 67½-years is 1½ times the synodic period of Saturn & Uranus or 360° + 180° = 540°.
Study all of the above in connection with the Hexagon Chart. It will really help you now!
- Gann’s Cube (The Hexagon Chart) By Daniel T. Ferrera
In hexagon 360 degree degree factor is 1.75 in which reason..