Trading Articles
Gann 50% Retracement Rule: Price Correction and Market Balance
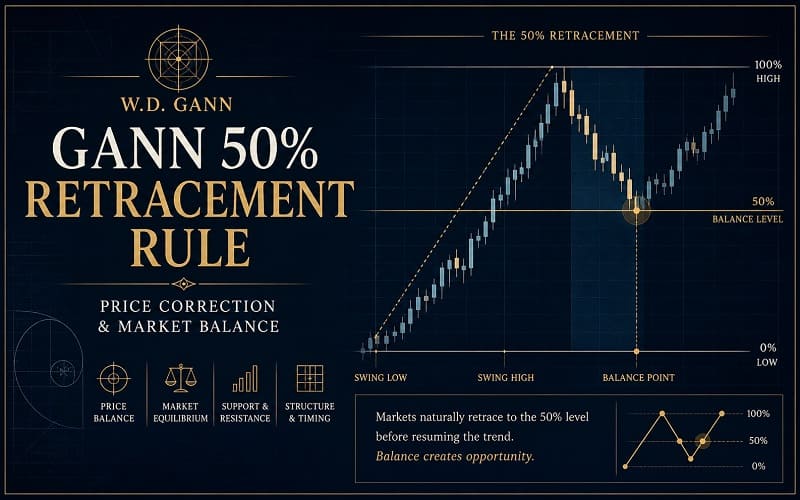
The 50% Retracement Rule, based on Gann’s 50% and 62-1/2% price levels, is this:
- GANN’S 50% RETRACEMENT RULE: AFTER AN INITIAL, SUSTAINED PRICE MOVE, EITHER UP OR DOWN, PRICES RETRACE TO 50% (4/8) OF THEIR INITIAL MOVE. IF THE RETRACEMENT EXCEEDS 50%, PRICES SHOULD CONTINUE TO THE 62-1/2% (5/8) LEVEL, BEFORE A REACTION OCCURS.
When prices begin to rise or fall, the most-important level at which some price reaction should occur will be the 50% level. For example, if prices have fallen from $2.00 to $1.00, and begin to rise, the strongest level of resistance to further price advancement should be expected at the $1.50 level.
The next important level is the 62-1/2% level. Again using the above example, if prices continue rising past the $1.50 level, the next level of resistance should be at approximately $1.63. If prices continue past the 62-1/2% level, the third-strongest level of price resistance should be at the 100%, or $2.00, price level. Just the opposite is true for prices that have been rising and are now beginning to fall. If a bull trend occurs from $10.00 to $20.00, prices will decline to $15.00 before reacting to the upside.
If prices continue to fall past $15.00, the next significant support level should be at the 62-1/2% level of the original bull move, or at about $13.80. Again, prices will react before continuing downward. Of the 7 Gann levels listed in Table 2, the 50%, 62-1/2% and100%levels are the most significant, and correspond to GEOMETRIC angles of 45 degrees, 63 degrees, and 90 degrees. These are the ones that will be used for determining Gann’s 50% Retracement Zone.
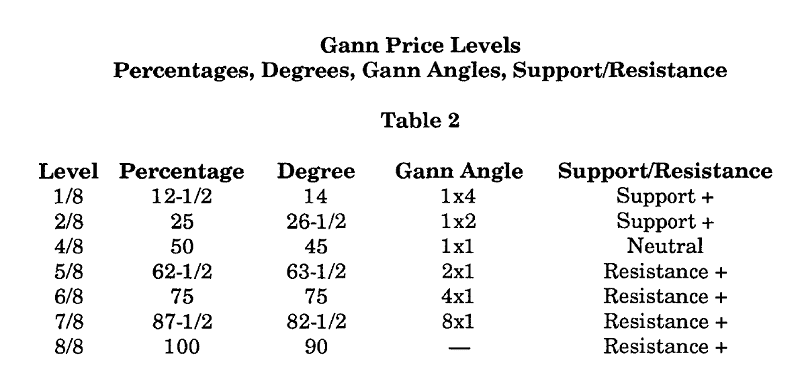
In addition, we will use 26 degrees (the inverse of 63 degrees) for “stops.” (Gann actually used geometric angles of 26-1/2, 45 and 63-1/2 degrees, but the 1/2-degree is not critical.) While the concept of using Gann Angles balances price and time, the geometric angles of 26, 45 and 63 degrees will be used to determine price-only movements. If Gann used these three angles and met with success, then there must be an inter-relationship between these angles, independent of a chart’s price and time scale.
Advanced Books and Courses on W.D. Gann Methods


It is this relationship between the geometric angles, and not the individual angles themselves, that is the basis for this exciting, simple method of following Gann’s work. Looking at the charts throughout this book, price ranges can be seen starting from a low or a high, moving up or down and, at some point, beginning to retrace the original price move. After these retracements, the original price trend continues. You see what will happen on Friday when it’s only Monday.
Hindsight is always better than foresight. Actual trading is a little different. Only price activity that has occurred, and that which is now occurring, can be seen. Evolving price activity may not always be as clear, when only a part of “the big picture” is seen. Remember, you are not dealing with something that is absolute. Commodity trading deals with events that have not yet happened. For this reason, it might be better to target a general “price zone” rather than just one number.
After that zone is reached, then you can “zero-in” to a single price target. Ideally, to calculate the 50% retracement levels, a trader would only have to select a range, subtract the low from the high of that range, divide by 2, and add the quotient to the low or subtract it from the high. But again, in dealing with events that WILL occur, rather than those that HAVE occurred, it is important to be flexible in your thinking. Prices may not always react to a single number, and may over- or under-shoot the 50% estimate.
Too, if you’re like me, math may not be your best subject. And did you ever try to add or subtract 32nds for T-Bonds? There must be a method by which you can estimate WHEN to place an order and AT WHAT PRICE, without devoting years of study to Gann. Establishing a “price zone” may be the answer. But how big should that “price zone” be? Where should the stop-loss orders be placed? (This is another Gann rule. NEVER trade without using “stops.”) And how can you SEE when to get in, or when to get out of, a position?