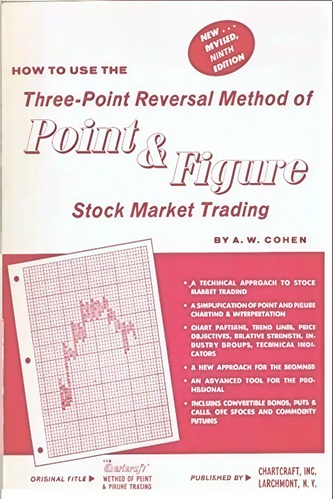
How To Use The Three-Point Reversal Method of Point & Figure Stock Market Trading
$19.04
Three-Point Reversal Method of Point & Figure Stock Market Trading by A. W. Cohen is a foundational guide to one of the most reliable and enduring charting techniques in technical analysis. Long before computers automated market pattern recognition, Cohen systematized Point & Figure charting into a precise, rules-based method — emphasizing clarity, simplicity, and discipline.
This book explains how price movements can be reduced to essential structure — columns of X’s and O’s — to reveal the pure supply-and-demand balance of the market. Cohen’s three-point reversal technique eliminates market noise and highlights genuine breakouts, trend reversals, and continuation signals. It’s a timeless tool that helps traders identify accumulation and distribution zones, project price targets, and maintain objectivity through volatile markets.
With step-by-step explanations, real chart examples, and a focus on practical execution, this book remains a must-read for traders who want to move beyond subjective chart reading and adopt a disciplined analytical framework grounded in price behavior itself.
✅ What You’ll Learn:
- The principles and construction of Point & Figure charts.
- How the three-point reversal method filters false signals.
- Techniques for identifying breakouts, reversals, and support/resistance levels.
- How to set and manage stop-loss levels using Point & Figure logic.
- Methods for projecting price objectives and understanding market momentum.
- How to integrate Point & Figure signals with other forms of market analysis.
💡 Key Benefits:
- Gain a clear, rules-based approach to chart reading.
- Learn a proven system used by professional traders for decades.
- Improve trade timing and accuracy by focusing on structure, not noise.
- Combine classical analysis with modern trading strategies.
- Build lasting confidence through mechanical, objective decision-making.
👤 Who This Book Is For:
Ideal for technical analysts, swing and position traders, and anyone seeking precision in chart interpretation. Beginners will find a clear introduction to the logic of price movement, while experienced traders will rediscover a timeless framework that sharpens analysis and strengthens conviction.
📚 Table of Contents:
- The Point & Figure Chart and Construction
- Chart Patterns
- Trend Lines
- Price Objectives
- Relative Strength
- Industry Groups
- The Dow-Jones Industrial Average
- Trading Tactics
- Convertible Bonds
- Over-The-Counters
- Technical Indicators
- Puts and Calls
- Commoditie
- Adjusting a Chart for a Stock Split
- The 5-Point Reversal Chart
How To Use The Three-Point Reversal Method of Point & Figure Stock Market Trading By A. W. Cohen
| Author(s) | |
|---|---|
| Product Type | Ebook |
| Format | |
| Skill Level | Beginner to Intermediate |
| Pages | 129 |
| Publication Year | 1984 |
| Delivery | Instant Download |
3 reviews for How To Use The Three-Point Reversal Method of Point & Figure Stock Market Trading
Only logged in customers who have purchased this product may leave a review.
Related products
Logan Delacruz (verified owner) –
Good book about Chart Patterns
Ricky Quintero (verified owner) –
Must read .
Celine Beltran (verified owner) –
First of all, this clearly is a used book and reviews posted here should be of the book, not the vender or what perceived collectors value should be. This is the best instructions of point and figure charts I have ever read. There should be a reprint of this book and it should be in every investor’s library. Until then, pay what you must to get the information you didn’t know you needed.