Trading Articles
The 360-Degree Cycle in Market Forecasting: Geometry and Time Analysis

Since there seems to be an interest in the research of Carl Futia, I have the following information to share from his work. This is related to the outer calendar of the Square of Nine, which is why I am posting thematerial:
1. Gann Students are well aware of the forecasting value of 360 units of Time or Price.
2. One is guided by the analogy of 360 units of Time or Price to the 360-deg in a circle or Cycle.
3. When studying cycles of Time, however, I have found it more helpful to take as a basic measuring rod the Solar Cycle of 1 year = 365.24 days, which = 360-deg.
4. We Therefore take 365.24 units of Time as the Fundamental Cycle.
5. When the units of Time are: Days, the basic Solar Cycle
Weeks- Symbolic Solar Cycle
Months- Symbolic Solar Cycle
Years- Symbolic Solar Cycle
6. The Symbolic Solar Cycle of 365.24 Years is known to Astrologers as the Symbolic Progression popularized by Sepharial. This progresses the natal planets each year by the average travel of the Sun in one day. It thus takes the day as the symbol for a year, as in the Bible.
7. My research on Stock Market Cycles has convinced me that the 365.24-year cycle is far more helpful than the 360-year cycle, thus lending some unexpected support to this symbolic progression from astrology.
8. How to Forecast using the cycle of 365.24 time units.
- (A) Pick a unit of Time (Day, week, month, year. 1-hour, 5-min, etc.)
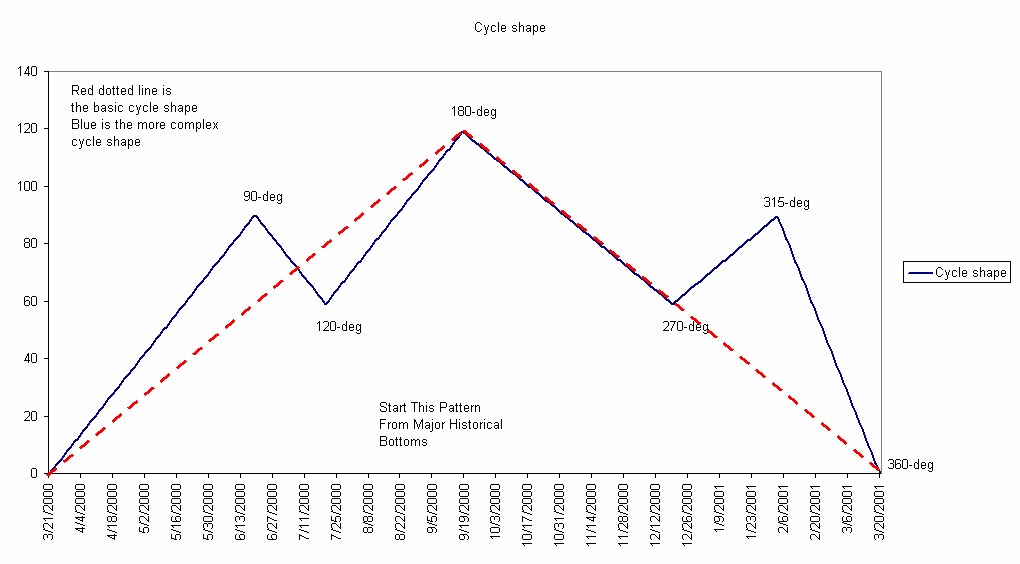
- (B) Pick shape and magnitude of Standard Cycle. Basic shape is start at a low and call this 0-deg, go up to a major high at 180-deg and then all the way back down at 360-deg. The more complex shape looks like a “Head & Shoulders” pattern, where you start from a low at 0-deg, then go up to a high at 90-deg, then decline to a higher low at 120-deg, advance to the highest level at 180-deg, decline to the 270-deg, which is about the same level as the 120-deg low point, advance to the 315-deg part of the time cycle and decline to the 360-point. See Graphic Illustration below.
- (C) Go back over price history and pick out “Significant” highs & lows from which to start your Standard cycles that you selected in (B).
- (D) For any given Time in the Future. Standard cycles from several different historical Highs & Lows will be “Active” simultaneously. For each point in time add up the values of these cycles.
- (E) The result of step (D) is your forecast.
- (F) A computer is almost essential for completing step (D).
9. Follow the rule 7 on page 41 of my course The Gann Pyramid for cycle inversions.
10. Harmonic Divisions of 365.24
45-deg = 45.66       225-deg = 228.28
60-deg = 60.87      240-deg = 243.49
90-deg = 91.31        270-deg = 273.93
120-deg = 121.75    300-deg = 304.37
135-deg = 136.97    315-deg = 319.59
180-deg = 182.62   360-deg = 365.24
11. This basic process can be applied to other natural cycle lengths, such as the Moons orbit, or any other satellite of the Sun.
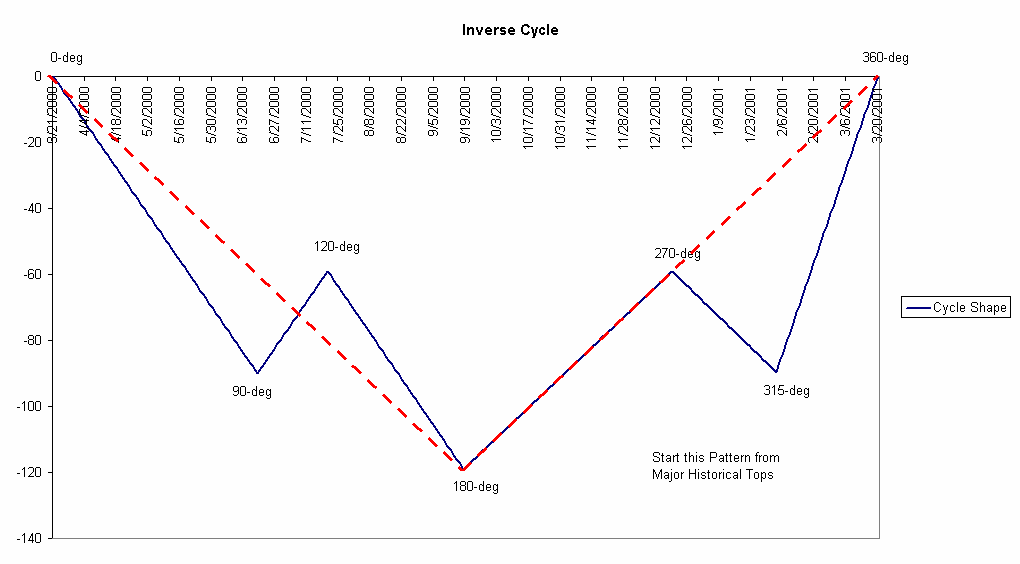
I have created the above charts in regards to your question on the Forum. Pages 19-22 of The Gann Pyramid illustrate the basic process of selecting significant highs & lows for step “C”. Mr. Futia did not provide any examples of this technique. What I posted was a “word for word” typed copy of what Carl said. Basically, what he is telling you to do is: go back over the historical data and find the major lows and run your cycle shape forward into the future. Next, find all the major highs and run the “Inverse cycle” forward into the future. Add all the information together, and the result is your composite forecast.
You can use a spreadsheet program like Excel to add up all the cycles from the different highs & lows. Now since Carl’s forecasting method is based on the Solar Cycle, your future dates will always be anniversary dates + the harmonic divisions of 365.24. For example, if you found a major low 40-years ago on March 21 st , you would determine that based on your cycle shape that the market should go up 90-deg to June 19 th , then down 30-deg to July 20 th (the 120-deg point). Then up to the 180-deg point on September 19 th , down to the 270-deg point on December 19 th , then up again to the 315-deg point on February 3 rd and finally back down to a low again on March 21 st , the 360-deg point.
Advanced Books and Courses on W.D. Gann Methods


These dates would always be the same for any year into the future. You would do this same process with other significant highs & lows and once you did the work, the future dates would never change because everything is based on the Solar cycle. Because Carl does not give any guidelines as to which years in the past you should use, you may want to consider Gann’s Forecasting course, which would have you looking back 1-year, 5-years, 10-years, 14 & 15-years, 20-years, 30-years, 40-years, 49-50-years, 60-years and 84-years to make up a forecast.
Another thing that you may want to consider deals with Carl’s inversion idea. As an example, last year (March 2000) the NASDAQ made its all time high at the Vernal Equinox. This year (March 2001) the NASDAQ had put in a major low on the Vernal Equinox after declining over 60%. Under Carl’s rules, you might call this a cycle inversion.
However, if you assume that this is really a 2-year cycle instead of a 1-year cycle, then these points would be exactly 180-deg apart and would fit nicely into the cycle patterns drawn above. If this is the case, then we would anticipate that the market would be down for the next 90-deg of a two year cycle, i.e. we are going down from the 180-deg point to the 270-deg point, which would put us at a low for September 19 th , 2001. Just an idea and some food for thought! Now back to your question about an illustration for “D”.
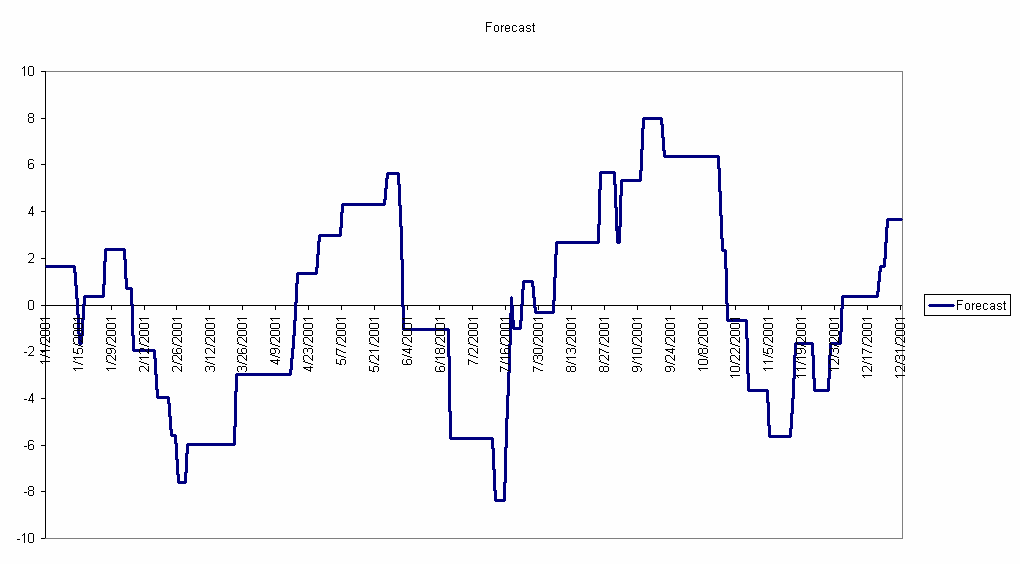
As a hypothetical, I took the dates 3/23/2000, 8/25/99, 7/17/98, 8/6/97 and 7/16/96, which were all tops and ran the “Inverse cycle pattern”. Then I took the dates of 10/18/99, 9/1/98 and 10/27/97, which were all bottoms and ran the regular cycle pattern. I simply built a sheet that gave a value of +1 to up-phase of the cycle pattern and a –1 to the down-phase of the pattern and added them all together.
The chart below is the result. The Forecast based on this technique was looking for a major low on 2/28/01 a short advance into 3/3/01. A sideways negative pattern to 3/22 followed by a rapid advance to 5/27 th . A strong decline into 7/14 followed by an advance to 9/20. Another significant decline into 11/14 th followed with a year-end rally. This is not advice, just an example of the technique in answer to your question.
The Forecast chart based on the Futia technique is on figure Below: