Trading Articles
Dow Theory Direction By Tim W. Wood
Why do opinions on Dow theory so often vary, and why do Dow theory “signals” so often fail? Typically, there is one common denominator that becomes immediately apparent in most articles about Dow theory: too many of the authors of those articles have not studied the original writings of Charles H. Dow, William Peter Hamilton, or Robert Rhea. These original writings and particularly those of Robert Rhea are essential if we are to understand what has come to be known as Dow theory. The only other person I know who has studied the original writings by Dow, Hamilton, and Rhea is Richard Russell. As a result, Russell is the only other orthodox Dow theorist I know of, and he has fought misquotes, misunderstandings, and erroneously written articles about Dow theory his entire career.
NONCONFIRMATION AND THE ONGOING BEAR
I first warned about the Dow theory non-confirmation, and the impending bear market, in October 2007. There was approximately a four-week period following the October 9, 2007, closing high on the Dow Jones industrials that was a classic “sell spot” in accordance with orthodox Dow theory. It was during this time that I began warning my subscribers and guided them through the developments as we watched the primary bearish trend take root. According to orthodox Dow theory, the primary bearish trend change finally occurred on November 21, 2007. It was then that the stock market barometer first forecasted “stormy economic conditions,” according to Hamilton.
Many market observers misunderstand Dow theory, viewing the violation of the previous lows or the bettering of previous highs to be a buy or sell signal in accordance with the theory. This is not true. In the writings of the founding fathers of Dow theory, the violation of joint secondary highs or lows is clearly considered to be confirmation of a primary trend change in which they would have already established positions at what they refer to as “buy and sell spots.” So the first myth I want to bust here is that Dow theory buy and sell signals do not come once a joint secondary high or low is exceeded. In reality, the violation of these levels serves as confirmation of the primary trend.
As the averages rallied out of the January–March secondary low points, and into the May–June 2008 and even the August 2008 highs, I continuously explained that nothing had occurred to invalidate the establishment of the November 21, 2007, primary bearish trend confirmation. Yet some who do not truly understand Dow theory misinterpret the movement above the February highs as bullish. The most important aspect of Dow theory is the joint movement of the industrials and the transports above and below previous secondary high and low points.
But the February highs were not secondary high points themselves. Rather, they were a high within the overall movement up into the April–May highs, which did constitute secondary points. It was from these highs that the averages moved down into their July secondary low points. Learning to identify what constitutes secondary high and low points is where the art comes into play, and this takes experience that can in part be learned from the writings of our Dow theory founders.
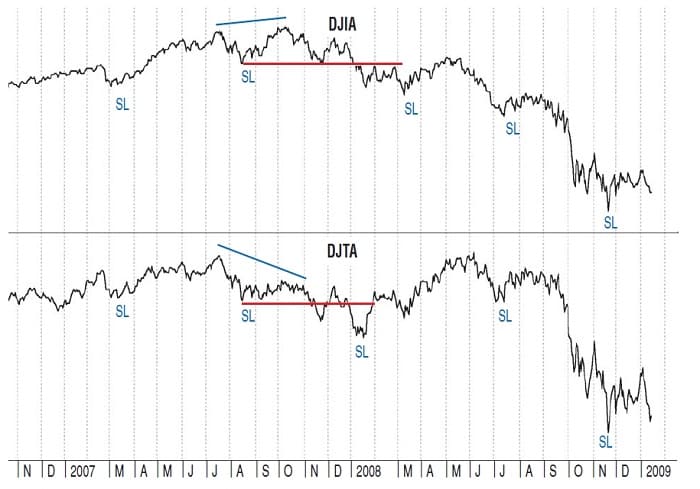
This is only one reason that their writings are so important. I have also identified other methods and developed specific indicators to help identify these secondary high and low points. As you can see in Figure 1, the averages last made a joint price low on November 20, 2008, which served to again reconfirm the bearish primary trend that was established on November 21, 2007. This is not to say that there won’t be bounces, but I believe that the November 20, 2008, low marked the most recent secondary low points. The key is understanding when a secondary low point has been made, what the advance into the secondary high point is telling us, and then identifying the turndown out of that secondary high point. This is an ongoing process that must be examined as it develops.
HOW LONG, MR. BEAR?
How long will this bear market last? Dow theory doesn’t directly offer an answer to this question, but there are some historical relationships that can be drawn upon. First, it is important to understand that the definition of bull and bear market differs from person to person. My definition is based on the works of the great Dow theorists — Dow, Hamilton, and Rhea. As a result of my study of Dow theory combined with my study of cycles, which are not a part of Dow theory, I have drawn some conclusions about the nature of bull and bear markets. As I read about the bull and bear markets of the late 1800s and very early 1900s, it became apparent that the bull markets that Dow, Hamilton, and Rhea wrote about were the upward movements of the four-year cycle and the bear markets were the downward movements of the four-year cycle. As our country grew, more and more people began investing and, as a result, the bull and bear periods became longer.
Suggested Books and Courses About Market Cycles
Bull and bear markets evolved into a series of multiple four-year cycle periods. For example, the first bull market to consist of multiple four-year cycles ran from 1921 to 1929 and consisted of two four-year cycles. The low in November 1929 was a four-year cycle low. The rally or “secondary reaction” that followed was the upside of a four-year cycle that topped in only five months. Once this secondary reaction was over, the DJIA moved down below the previous four-year cycle low and into the 1932 four-year cycle low, which proved to be the bear market bottom. The 1921–29 bull market advanced a total of 568%from the 1921 four-year cycle low at 67 on the DJIA to the 1929 four-year cycle top at a high of 381 on the DJIA.
The next great bull market began with the four-year cycle low in 1942 and ran to the four-year cycle top in 1966. This time, the primary bull market was made up of a series of six four-year cycles and advanced a total of 1,076% from the 1942 four-year cycle low at 93 on the DJIA to the 1966 four-year cycle top at a high of 1,001 on the DJIA. This bull market advance was roughly double the preceding great bull market. The bear market that followed was also a series of four-year cycles. From the 1966 four-year cycle top, the bear market moved down into the 1974 bear market low. This was a series of two four-year cycles.
MARKET ANALYSIS
Now, I want to focus on the bear market declines. Prior to the first great bull market that ran between 1921 and 1929, the bear markets averaged some one-third the duration of the previous bull market. This relationship has also held true with the extended bull market periods as well. For example, the 1921 to 1929 bull market was eight years in duration and the 1929 to 1932 bear market was three years, making the bear market duration 37.5% of the preceding bull market. The period between 1932 and 1942 was a base-building recovery period that followed the Great Depression. The 1942 to 1966 bull market was 24 years in all and the 1966 to 1974 bear market was eight years, which was 33.3% of the duration of the preceding bull market. From my perspective, the last great bull market of all time began with the 1974 four-year cycle low. Some say that it began at the 1982 low and I understand that argument. However, it is my opinion that 1982 was simply when the bull market broke out and became apparent.
At the 2000 top, the associated Dow theory non-confirmation and confirmed primary trend change indicated that the great bull market era had ended. Upon the primary trend confirmation in March 2000, all indications, according to Dow theory, was that phase 1 of a great bear market had begun. In addition, based upon the historical relationships between bull and bear markets, that bear market was slated to run into the 2008–10 time frame, which was 33% to 37% of the preceding bull market. When the rally out of the 2002 low began, it appeared that this was simply the rally separating phase 1 from phase 2 of the bear market. (Refer to my April 2008 STOCKS & COMMODITIES article because according to orthodox Dow theory, the primary trend again turned bullish in June 2003 and proved that price movement above and below secondary high points is far more important than the perceived phasing.)
During this period, the powers that be threw everything they had at the market and in doing so allowed the bear to claw its way out of existence. And when both averages managed to better their 2000 highs, everything changed in accordance with Dow theory phasing. At that time, I said, “This confirmation does not signal a new bull market, but rather reconfirms the existing bull market.” What I meant was that the bull market that began in 1974 was reconfirmed as still being intact when both averages jointly bettered their 2000 highs, and that we had never entered into a true bear market. That was written on February 29, 2007. The advance that followed this reconfirmation carried the averages up into their last joint high in July 2007 and can be seen in the Dow theory chart in Figure 1.
From the July 2007 joint high, the averages moved down into their August 2007 secondary low points. It was from that secondary low point that things again began to deteriorate. As you can see in Figure 1, the industrials moved on to new highs in October while the transports failed to confirm. This non-confirmation is noted in blue. This non-confirmation led to the November 2007 decline. With the break below the August 2007 secondary low points (noted in red) on November 21, 2007, the primary trend was once again confirmed as being bearish. That break put the market at risk of finally marking the top of the entire bull market advance that began in 1974 at 570 of the industrials.
As of the October 2007 high, the bull market advance that began in 1974 has now run 33 years and consisted of eight four-year cycles with a total advance of 2,385%. This bull market advance has been roughly double the previous bull market advance in terms of the percentage move out of the low in which the bull market began. Did the October 2007 top mark the top of this entire bull market advance up from the 1974 low? If so, we are now operating within the context of a much longer-term secular bear market that should serve to correct the entire 1974–2007 bull market. In addition, based upon the historical bull and bear market relationships of the past, the 33-year bull market period should be corrected by a 10- to 12-year bear market, which, based on the 2007 top, would take the bear market down into the 2017–19 time frame.
Back in 2000, the bull market from 1974 was only 26 years in duration, and one-third of that would have been some eight to nine years, which means that if they would have let the bear market that tried to begin back then unfold, we would now be coming out of a natural bear market bottom in which a real advance could have occurred. Instead, they fought it tooth and nail and were ultimately able to extend the bull market into 2007.
HOW MUCH LONGER?
This only served to make matters worse. We now have a 33-year bull market to correct, and we are only one year into the correction, and again, the powers that be are trying to “fix” it. I do not think it can be fixed, as they have only made matters worse; we now face the fallout of the credit bubble, the housing bubble, the commodity bubble, and an even larger stock market bubble, all of which were a result of the “fix” following the 2002 low. It all comes down to this. If we have truly seen the bull market top, then we still have some nine-plus years to go based on these typical bull/bear market relationships, and fighting it will at best only extend the inevitable and make matters worse in the end.