Trading Articles
Do Chart Patterns Still Work By Thomas Bulkowski

Has the failure rate of chart patterns increased in recent years? In the last several years, have you found it more difficult to make money in the stock market? Do you get the feeling that indicators are less effective than they used to be in spotting profitable opportunities? I decided to find the answers to those questions with a new study. I spent a week updating a database of chart patterns that I used during research for writing my books, and found an alarming result.
In my investigation, I used 13,932 chart patterns spread over the years from 1991 to 2008. I did not use all of the chart pattern types in my analysis but concentrated on 23 of the most common and popular. They are: diamond tops and bottoms; double tops and bottoms (eight types of Adam and Eve combinations); triple tops and bottoms; rising and falling wedges; head & shoulders tops and bottoms (four types of simple and complex); ascending, descending, and symmetrical triangles; and rectangle tops and bottoms.
Excluded were broadening patterns (six types) and scallops (four types) because of the difficulty in determining where the breakout is. Horns and pipes also did not make the cut because they perform best on the weekly scale. I only tested chart patterns using daily price data. The plethora of patterns means that when separated into years, there were an average of 425 samples per year, and I wanted to keep the sample counts as high as possible for a statistically meaningful result.
UPWARD BREAKOUTS
I split the data into two types of patterns, those with upward breakouts and those with downward ones. Figure 1 shows three failure rates from chart patterns with upward breakouts. I calculated the rise using the closing price from the day before the breakout (to include breakout day gaps) to the ultimate high, which is the highest peak before price dropped by at least 20%(signifying a trend change), or closed below the bottom of the chart pattern. Then I counted the number of patterns that failed to show post-breakout rises of 10%, 20%, and 40% before the trend changed. The lowest of the three lines is the 10% failure rate. It begins with an 11% rate in 1991 and ends with 32% of the chart patterns with upward breakouts failing to show price rise by at least 10% after the breakout. Based on this scale, chart patterns have become three times more difficult to trade profitably.
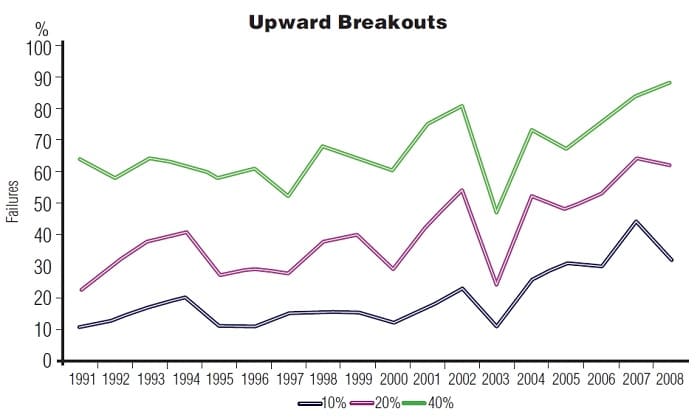
The middle line shows a similar upward trend beginning in 1991 with 22% failing and ending in 2008 with 62% failing to rise by at least 20%. Again, that is nearly triple the failure rate since 1991. The top line shows how rare stellar chart pattern performance really is. It begins with 64% of the patterns in 1991 failing to post rises of at least 40% and ends in 2008 with 88% failing. Even for stocks that do very well, the likelihood of finding a highly profitable trade has diminished. The chart includes two bear markets. The first one is from March 2000 to October 2002, as measured by the close-to-close decline in the Standard & Poor’s 500. The lines show that failures increased as prices started tumbling in 2001 and 2002. In 2003, when the market began to recover, the failure rates made a dramatic reversal, dropping by half in the 10%and 20% categories and almost by half at the 40% rate. In other words, chart patterns with upward breakouts worked better after the bear market ended.
Suggested Books and Courses About Chart Patterns


The improvement was short-lived. After 2003, the failure rates began climbing again, peaking in 2007 at their highest level. Then the second bear market took hold in October 2007 and lasting throughout 2008. Oddly, the failure rates declined during this second bear market, but that could be due to the low sample count (171 in 2007 and 138 in 2008). Note the upward trend over the years. Failures in 1991 were a third of what they were in 2007. Trading chart patterns and making a profit have become substantially more difficult.
DOWNWARD BREAKOUTS
Do downward breakouts from chart patterns exhibit a similar trend? Figure 2 shows the result. The performance measure is from the closing price the day before the breakout to the ultimate low. The ultimate low is the lowest valley before price rises by at least 20% or closes above the top of the chart pattern.
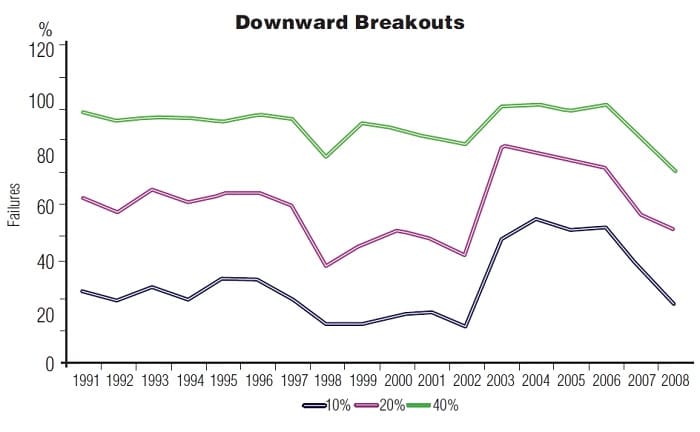
It is more difficult to make big money by playing a downward breakout (shorting) because a stock can lose only 100% of its value. For upward breakouts, however, the gain can be unlimited. The figure shows this by the altitude of each line. A trader expecting to make at least 40% on a trade by shorting a stock after a downward breakout from a chart pattern can expect a success rate no higher than 26% of the time (in 2008); about one in four trades will work. That is, 74% of them will fail. For the worst case, the success rate drops to just 1% (in 2004 and 2006). In fact, 13 of 18 years had success rates on or below 10% (that is, failures were above 90%).
In each case, the failure rate is lower in 2008 than it was in 1991. During the 2000 to 2002 bear market, the failure rates are below the failure rates during most of the 1990s. Down-ward breakouts are doing well in this current bear market, as the downward trend since 2006 shows. The large bump up in 2003 is a reflection of the change from bear market (2002) to bull market (2003). If the market is trending higher, then downward breakouts tend to fail more often, meaning that the post-breakout drop is less severe. Downward breakouts work best in a bear market. Avoid trading them when in a bull market or when many stocks are trending higher, especially after a bear market ends.
CLOSING POSITION
The average 10% failure rate for upward breakouts is 20%, meaning that 20% of chart patterns fail to show post-breakout rises of at least 10%. Since 2003, only one year (2003 at 11%) had a failure rate below 20%. In the 1990s, the average failure rate was just 14%. In the 2000s, the rate had climbed to 25%. It is almost twice as hard to make 10% on your money than it used to be. That is not a fair comparison because 2000 to 2002 and 2008 were bear market years and the 1990s were bullish. By removing bear markets, the result actually climbs, to 28% of chart patterns with upward breakouts failing to show post-breakout rises of at least 10%. Downward breakouts show that the average failure rate climbs from 26% in the 1990s to 49% in the bull market years after 2002. That is almost double.
The results shown in the figures are based on thousands of perfect trades, buying at the closing price the day before the breakout and holding the stock to the highest peak (upward breakouts) or lowest valley (downward breakouts) before a significant trend change occurs. If you are less than a perfect trader, then your results may be even worse. If you think that the markets the last few years have been difficult to trade, you’re right.
Thomas Bulkowski is a private investor with nearly 30 years of experience. He is the author of several books, the most recent of which is Encyclopedia of Candlestick Charts.