Trading Articles
Diary Of A Strangle By Charles Steiner
Here’s how you can apply this low-risk option strategy. Option strategies can be created to accomplish almost any speculative objective. One low-risk option strategy is the short strangle. Simply stated, a strangle is a combination of an out-of-the-money put and an out-of-the-money call with the same expiration date. The obvious advantage of this combination is that there is an expectation of a 50% or greater probability of success because only one of the two options could be in-the-money at expiration. Therefore, in setting up a strangle you must determine where the option probably will not go rather than where it might go. There must be an exit or hedging plan in the event that one side of the strangle ends up in-the-money. Another advantage of the short strangle is that it is margin-efficient.
Being out-of-the-money, the margin requirement is reduced and only the side closest to being in-the-money is used to compute margin. An additional advantage is that this strategy lends itself to delta-neutral trading by allowing dynamic hedging, which is the addition or subtraction of short or long positions in the underlying security or additional option positions.
Delta-neutral refers to the strategy of balancing the positive deltas of the short calls against the negative deltas of the short puts to reduce the risk of the position in order to allow the time decay of the premiums collected to work its magic. Delta is the relationship between the change in the price of the underlying asset to the change in price of the corresponding option. The delta of a short 100 call would be +0.50 when the underlying was valued at 100. Thus, the option price would decrease about 0.50 if the underlying fell to 99, all other factors remaining the same. At 101 the call option would be expected to increase 0.50 under the same circumstances. The delta of an at-the-money short put would be -0.50 and the option would increase in value as the price of the underlying dropped and the put option would decrease in value when the price of the underlying increased.
DETERMINING RISK
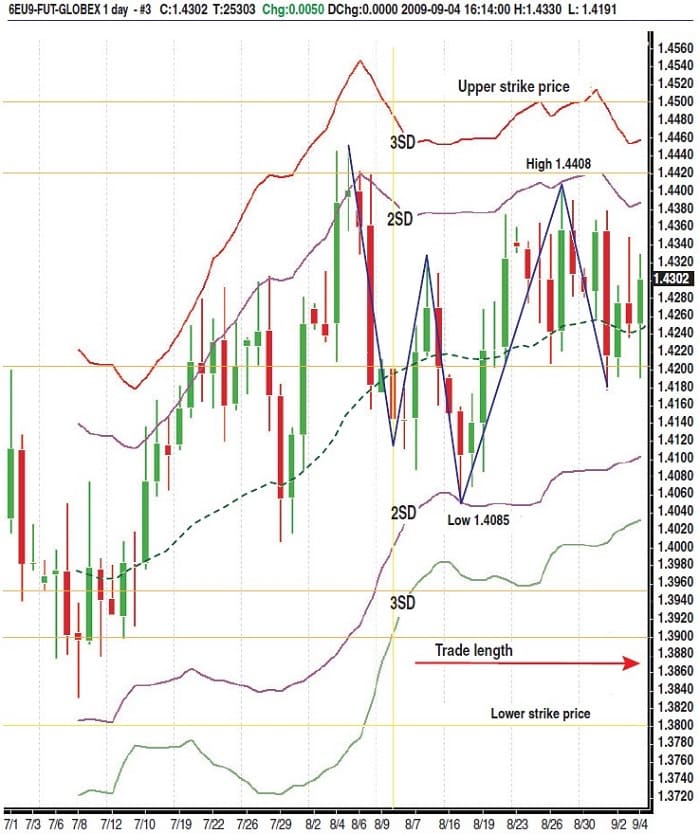
One method of determining risk is by using Bollinger bands, which are constructed by measuring the standard deviations of prices over a period of time. Approximately 95% of the time price is confined within two standard deviations (SD) and 99% of the time price is confined within three standard deviations. In times of low volatility, the bands narrow, and in times of high volatility, the bands expand.
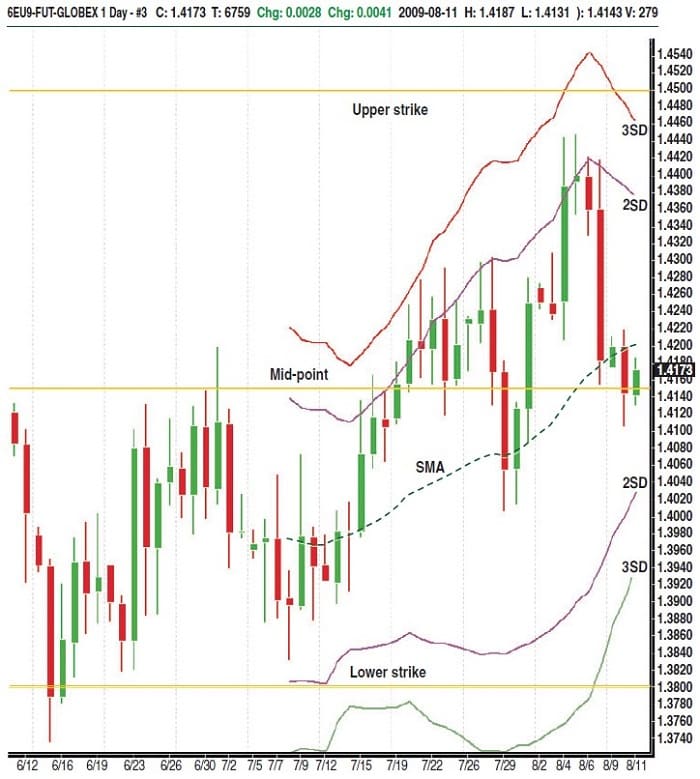
Figure 1 of the September 2009 EUR/USD contract shows a nine-week trading range of the contract. The five-week uptrend shows prices following the upper 30-day two–standard deviation (2SD) line. The recent correction has brought prices close to the 30-day moving average and provided an opportunity to sell a strangle near the midpoint of the trading range. A lower strike of 1.3800 was chosen because it is near the nine-week low and the upper strike of 1.4500 was chosen because it is near the three–standard deviation (3SD) line. For the next four weeks, I anticipate that the euro futures contract will remain within a seven-point trading range. However, since there is no guarantee — only an excellent probability — deltas will be computed at 4:00 pm ET each trading day using an Excel spreadsheet to visualize and manage risk.
On August 10, 2009, using a direct-access Level 2 trading platform, I sold two Globex September 145 calls and two September 138 puts for 1.06 points ($1,325) per strangle. Offers to sell were placed midway between the bid and ask prices and the orders were executed as the underlying futures price moved in a narrow range. The options will expire on September 4, 2009, or in 25 days. The delta of each strangle was zero or neutral. Initial margin was about $4,500 plus the $2,650 premium collected.
Prior to selling the strangle, I used modified Black-Scholes calculators to determine the fair value of both options and their respective delta values. The inputs were the price of the futures contract, strike price of the option, volatility, days to expiration, risk-free interest rate, and the ECB interest rate. The volatility input was the 30-day annualized volatility, or 8.7. The fair value of the puts and calls was 0.23 each, with a delta of 0.14. Based on market price, the calls were 2.39 times overpriced and the puts were 2.22 times overpriced, assuming my volatility prediction was correct.
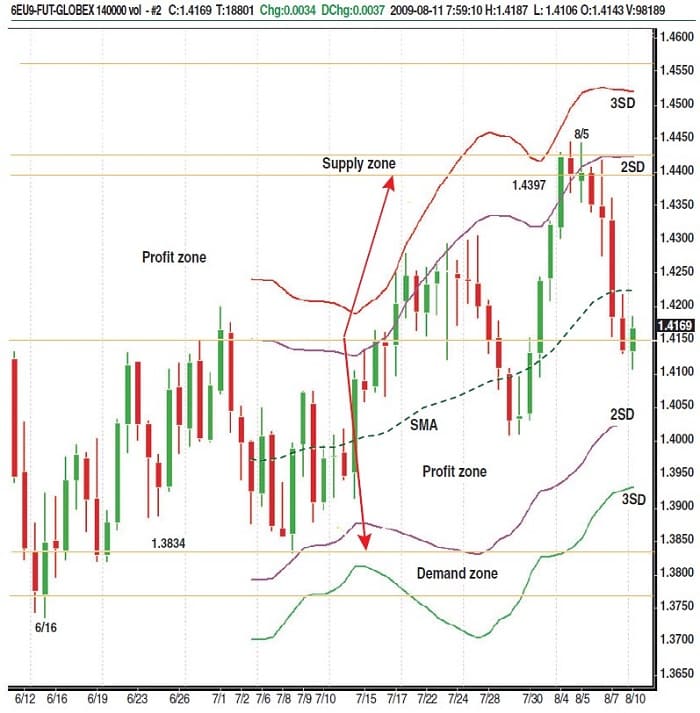
Another method of determining both strike prices for a strangle setup is to look at the trading range for the last one or two months and determine the location of the supply zone, demand zone, and equilibrium or profit zone. Looking at Figure 2, which is an equivolume chart of current open interest, an astute trader would have bought the euro futures contract on June 15, 2009, at about 138.34 and would have sold on August 5, 2009, at about 143.97 for a profit of about 5.63 points or about $7,000. During the period of this hypothetical, ideal trade, the euro traced five waves up over a period of seven weeks and the open interest turned over more than 50 times.
Suggested Books and Courses About Trading With Indicators
The demand zone is defined as the area where demand exceeds supply, causing price to rise, and the supply zone is defined as the area where supply exceeds demand, causing price to fall. The area between these two zones is an area of equilibrium where the forces of supply and demand struggle to the point of exhaustion, at which time price reverses. This area can also be called the profit zone because a long trade initiated when demand was the greatest and held until supply exceeded demand would have provided the maximum profit. Therefore, the lower strike price of 138 falls in the prior demand zone and the upper strike price of 145 is above the prior supply zone and the point of entry lies near the middle of the profit zone.
THE STRATEGY
The strategy defined here is to sell both sides of the strangle, anticipating a resumption of the uptrend or a three-wave correction over the next four weeks. No adjustments to delta will be made between 138.34 and 143.97 using an underlying futures contract. However, a dynamic hedging, delta-neutral strategy will be employed if price moves outside of this zone. Price will approach either or both zones because it tends to reverse at prior significant highs or lows or price will test these areas, producing a double-top or bottom reversal, or price will thrust through, resuming a major trend. In any event, a hedging plan will be in place to address any one of them.
In the real world, the unexpected occurs more frequently than the odds predict (Figure 3). The trade progressed smoothly until August 27, 2009, eight days prior to expiration, when the futures contract hit the predetermined buy-stop of 143.97. I bought a mini euro futures contract at 144.00, the value of which was ‑0.50 delta. I remained long the future until expiration on September 4, 2009, because of a bullish bias based on the chart pattern and a wish not to be whipsawed in the final days until expiration. The deltas of the puts and calls both became zero on September 1, when the euro closed at 142.30 and both option deltas remained zero until expiration. In addition, both the upper and lower 2SD bands were touched once during the four-week trade interval. Initial volatility was 8.7, which declined to 7.4 at expiration because of the narrow trading range.
The underlying futures contract traded at 143.10 on September 4, 2009, at 3:00 pm ET option expiration with the 145 calls and 138 puts expiring worthless. The final profit & loss: total premium of $2,650 minus the loss on the mini euro futures contract of $406, which was sold on September 7, 2009, for 143.35, for a net profit of $2,244 minus six commissions. Based on a $4,500 margin requirement, this particular 25-day strangle strategy produced a 50% monthly return on margin, or 600% annualized.
MANAGING YOUR STRATEGY
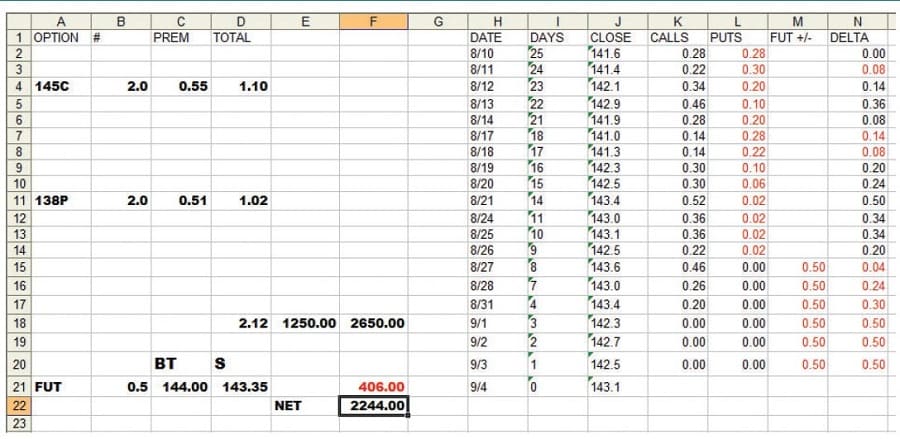
Multiple outcomes are possible to any option strategy based on price movement, volatility changes, and dynamic hedging intervals. In this actual trade, the futures remained in a price range: low 140.85 and high 144.08, or 3.23 points, well within the predicted range of seven points. In retrospect, the -0.50 delta futures hedge was not necessary but would have increased the profit and reduced the risk if the future had closed between 144 and 145.33. The Excel spreadsheet (Figure 4) is an effective method of managing any complex option strategy such as delta-neutral trading and dynamic hedging. Most professional option sellers trade delta-neutral because of the high risk of uncovered selling and their goal to create a risk-free, neutral position that will capture time decay and the disparity between the true value of an option and its inaccurate market price.
Before entering any option selling strategy, market participants must calculate fair value vs. market price in order to discover and sell overvalued options. All possible outcomes must be anticipated and a risk management strategy must counter a move that extends beyond the anticipated price range or an error in predicting future volatility. In addition, the option seller must determine the technical position of price. At the midpoint of a trading range, simultaneous selling of both sides might be the best strategy.
At a price reversal, it might be more profitable to leg into a position by selling only one side of the strangle and wait for the next reversal to leg into the other side. Decisions must be made about dynamic hedging intervals, margin management, stops, profit taking prior to expiration, the type of hedging employed (options or futures), action to take upon a reversal, rolling up or down to another strike price, or exit before expiration. During the life of a strangle, the trader must anticipate and manage the profits and losses that result from dynamic hedging so they will not adversely affect the bottom line at expiration.
Technical analysis, Excel spreadsheets, the Black-Scholes calculator, and a risk management plan should be your road map to a profitable option selling strategy. Electronic trading has leveled the playing field so the individual trader can be as much of a market maker as his skill, risk tolerance, and bankroll will permit.
A retired dentist, Charles Steiner started selling stock options in 1972. Currently, he uses technical analysis to trade electronic futures and sell options on futures.