Trading Articles
Cyclicality in Markets: Structural Recurrence and Timing Principles

Price actions of various stock issues and commodity contracts have many elements in common in spite of the fact that the individual charts often look dramatically different. This is known as the Principle of Commonality. It is this principle that makes the methods taught in this course applicable to all negotiable equities on all of the markets of the world. There are seven elements to the Principle of Commonality. These seven elements will be discussed individually in the following material. The most fundamental element of commonality is the fact that all price movements of all stocks and commodities consist of a combination of the same number and kinds of single price waves. This is known as the Principle of Cyclicality and is an element of Commonality. It is this principle that makes possible a degree of prediction of the time of occurrence of price reversals and the extent of the subsequent price move.
Price Waves
- A price wave is a simple, symmetrical, and infinitely repeating oscillation or fluctuation in price from a trough to a crest and back again. Figure 1-1 is a graphic illustration of the shape of such a price wave.
- A single repetition of a wave movement is called a cycle. In figure 1-1 two complete cycles of a single wave are shown. Note in figure 1-1 that a single price wave varies above and below zero price, hence can take on both positive and negative price values.
- Stock and commodity prices cannot, however, be zero or negative. As we will see later, prices vary in this wave-like manner about some positive price level that is high enough so that prices never become zero or negative.
Study figure 1-1 with care until you have absorbed the meaning and implications of this simplest of wave concepts, then:

A simple, single price wave of the kind that combines to form stock and commodity price action. Only two cycles of this wave are shown, but the wave itself extends infinitely far to the left and to the right. Such waves repeat themselves cycle after cycle. As a result, once the wave is identified, its value can be determined at any past or future time. It is this characteristic of waves that provides a degree of predictability for equity price action.
Advanced Books and Courses on Market Cycles & Timings


A Cyclic Trade
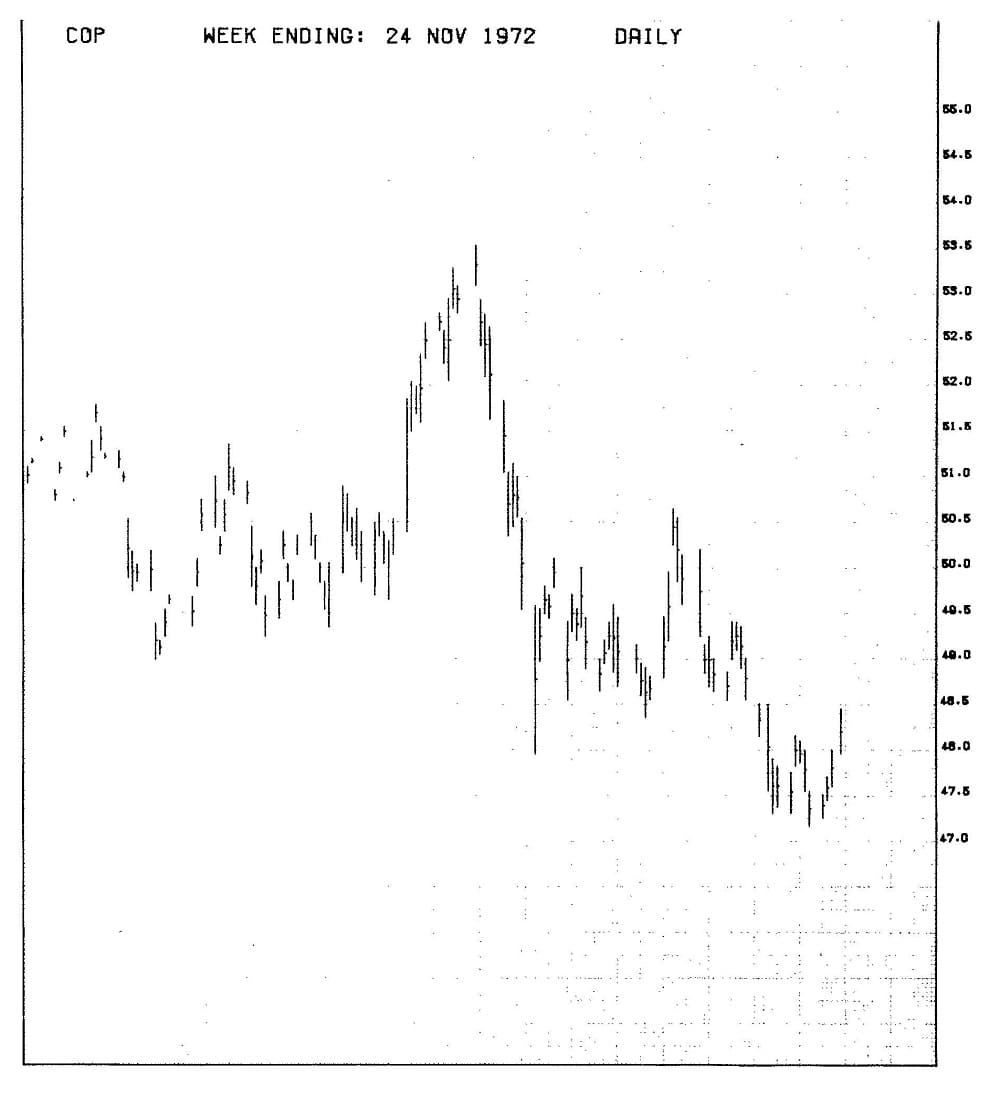
Figure 1-2 is a daily price bar-chart of the March 1973 commodity futures contract for copper. It was selected as being typical of commodity futures price action. Some degree of rhythmic, wave-like motion of the kind we have been discussing is visually apparent in this chart. In spite of this fact, it is almost impossible to estimate with any degree of certainty what prices are likely to do next – just by observing this chart alone.
Several questions need answering: Should this contract be bought, sold short, or left alone at this time? When and at what price level will the downward move now underway be reversed? When it is reversed, how far will prices then move up? What risks would be incurred and what profits hoped for if one were to enter into a transaction in this contract now?
This section has been provided at this very early stage in your training to demonstrate that answers to questions such as these can be obtained by making proper use of cyclic concepts. You should not attempt at this point to understand the processes necessary to arrive at such answers. Understanding will come to you as the course progresses. Right now it is enough if you are impressed with the fact that cyclic concepts can provide so much information about the probable future of price moves. If you are thus impressed, it is hoped you will then be strongly motivated to bring yourself to the level of expertise required to make proper use of the concepts and methods taught in the rest of the course.
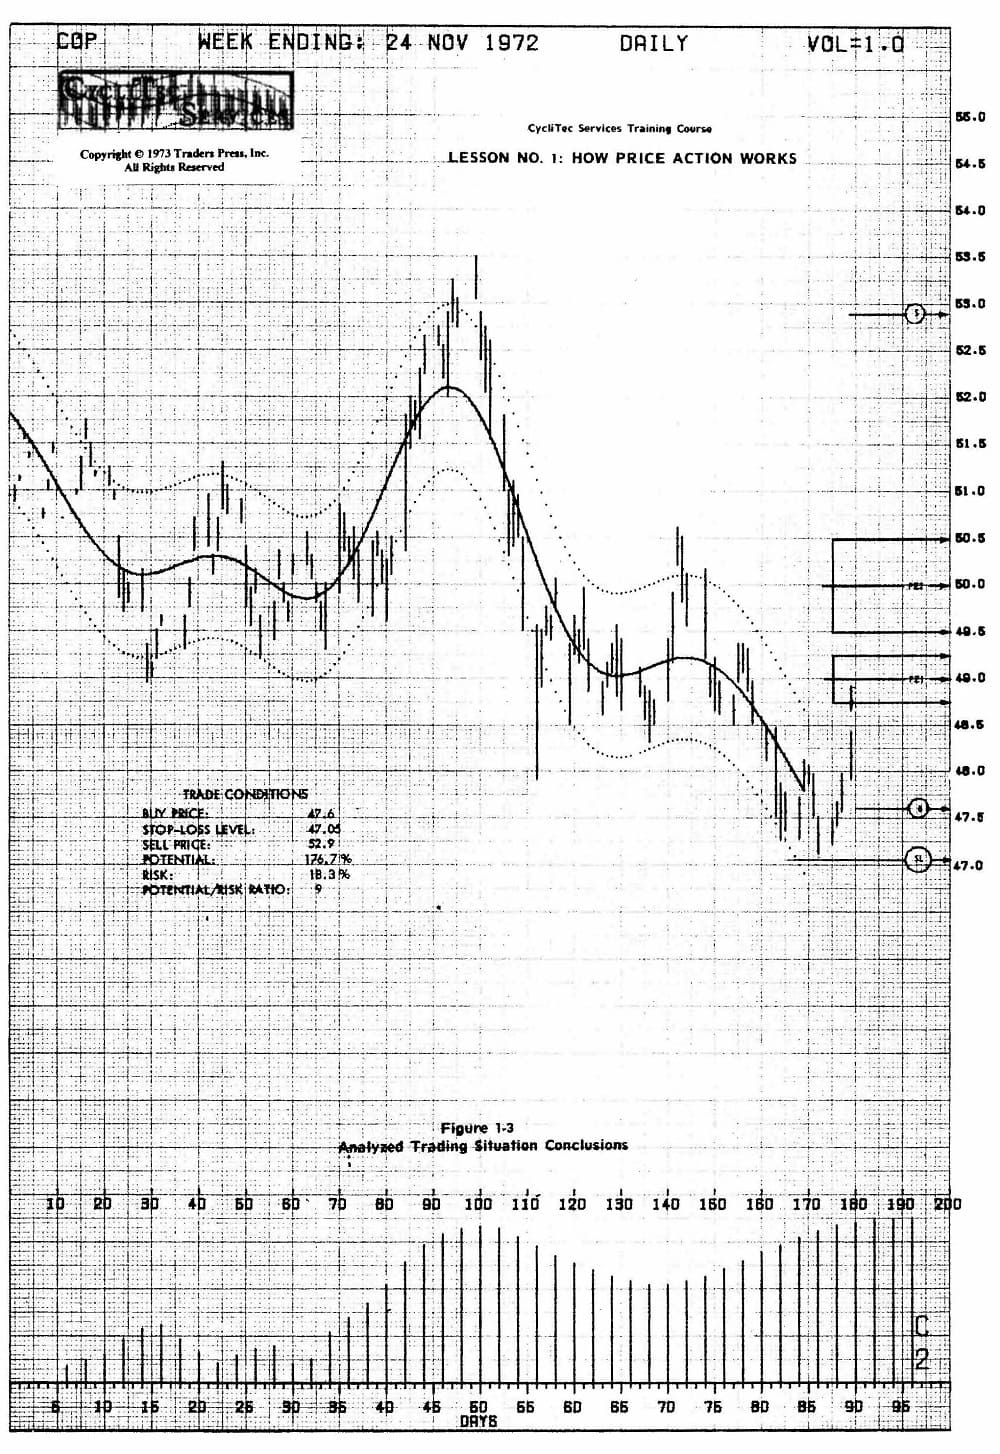
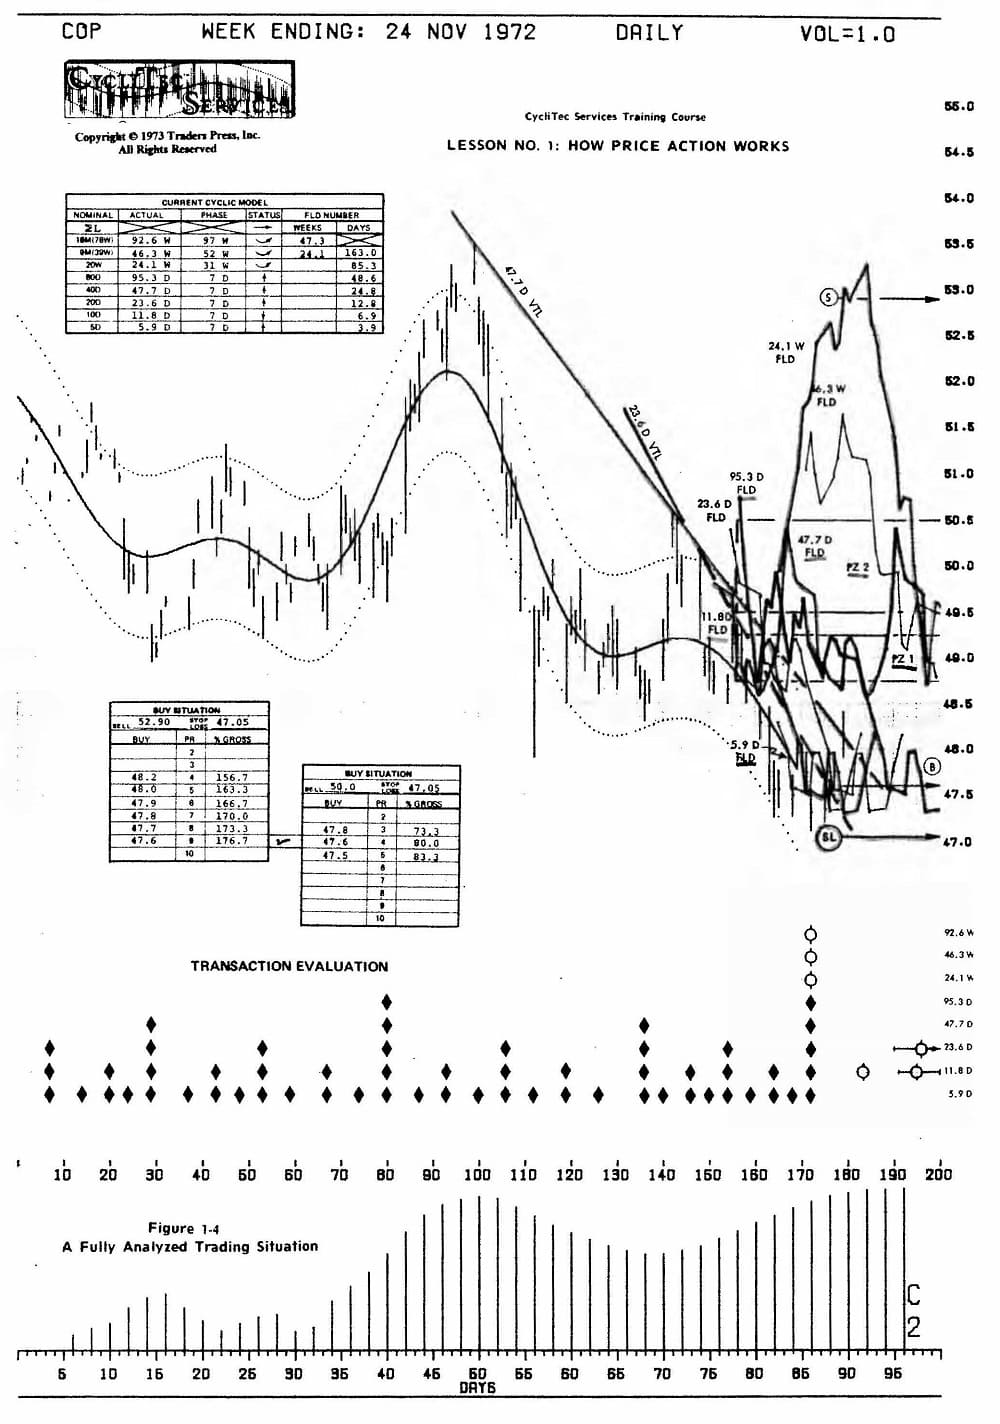
Please turn now to figure 1-3. Here you see exactly the same price bar-chart shown in figure 1-2. However, new information has been added. From this information, from knowledge of cyclic concepts, and with the analysis techniques taught in this course, a complete graphical analysis was constructed. From this analysis certain conclusions were drawn. Some of these conclusions are shown in the figure and the remainder are described in the text to follow. The graphical analysis that provided the conclusions is presented in figure 1-4 so you will realize that these conclusions were not arrived at by guess work, but by well defined techniques. By the time you have completed this course, you should be able to perform such analyses for yourself on any stock or commodity you select.
Do not become lost in the complexities of the analysis itself. The pertinent conclusions from the analysis are all that need concern you at the moment. Referring to figure 1-3, the first five of these conclusions are as follows:
- This contract should not under any circumstances be shorted at this time.
- It is highly probable that sometime very soon prices will stop going down and reverse to go strongly up.
- Probabilities strongly favor that this reversal of price motion has already started, and that prices will not go below the low reached a week ago at 47.10 until they have first reached the price (marked S} of 52.9. In the process, prices should pause in the zones of PZ1 and PZ2.
- In spite of the long downward move over the last 12 weeks, prices for the last week have been moving slightly up. This short up move will, with high probability, reverse within a few days, and the contract should then trade in the vicinity (marked B) of 47.6.
- If you should decide to initiate a trade, your instructions to your broker would be to buy if prices retreat to 47.6. If they do so, and if your purchase is made at this price or better, he should immediately enter a stop-loss order at the price marked SL in the figure. At the same time, he should enter a good-until-cancelled sell order at the price marked S.
Now please turn to figure 1-4 where the remaining conclusions can be more easily followed. On the day that this analysis was made, you would also have known the following:
- If you placed such orders with your broker the following Monday, the probabilities would strongly favor a successful trade.
- The potential gross gain for the trade would be 5.3 price units, or 176.7 percent (using minimum margin available at the time}.
- To say that probabilities strongly favor a successful trade does not mean that the trade cannot go wrong. However, if this trade should go wrong, your losses are likely to be of the order of 0.55 price units, or 18.3 percent. Thus, you stand to gain approximately 9 times as much on the transaction as you stand to lose.
- If these were acceptable odds to you, you might make the decision to proceed. If not, you would decide to look for a more attractive situation. It is important to notice that these methods of analysis permit you to assess the situation in this highly quantitive way before you enter a transaction. Herein lies the big difference between the Cyclic Concept approach to trading or investing and other approaches.
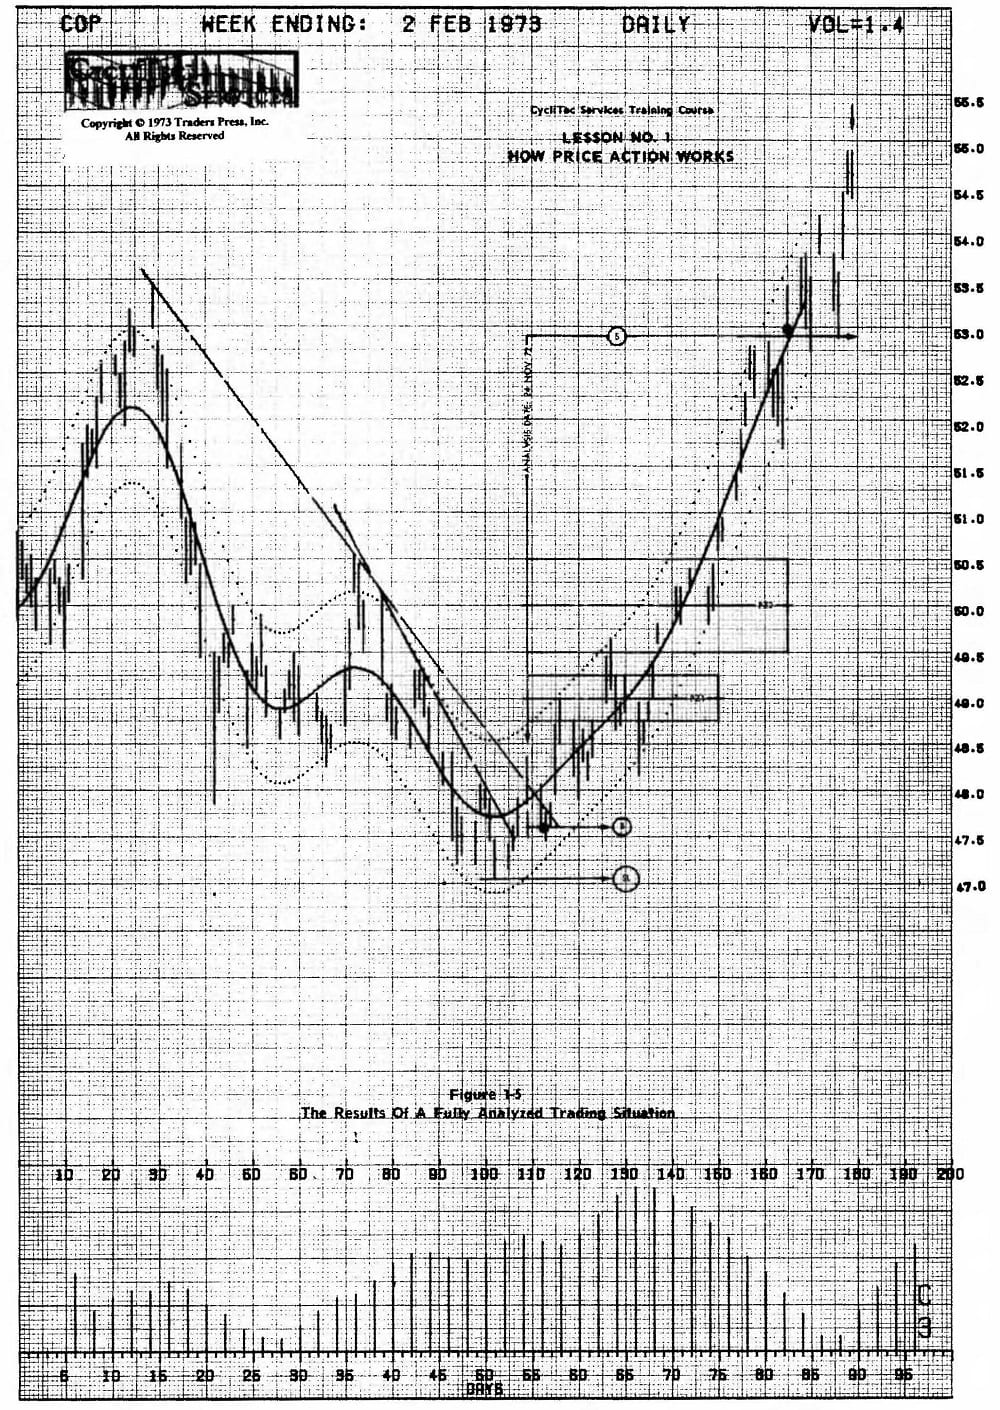
Now turn to figure 1-5, which shows what prices did through 2 February 1973. The stop-loss level, buy price, and sell level established on 24 November 1972 have been drawn in.
Note that:
- Prices did, indeed, withdraw over the next several days after 24 November, permitting a purchase at the desired buy price.
- They did, indeed, reach the selling objective without going below the stop-loss level again.
- The down move prior to 24 November 1972 was, indeed, in the process of being reversed at the time of the analysis.
- Prices did pause in the price zones PZl and PZ2 before going on up to the sell level.
You must be cautioned that such analyses will not always result in a successful trade such as this one. All that can be said is that experience to date indicates that the probabilities favor success over failure. Even if your success ratio were only 50 percent, the fact that profits would exceed losses in size by a factor of 2 or 3 would assure net profits over a number of such trades.