Trading Articles
Cup and Cap Chart Patterns: Price Action and Market Reversals
Our next indicator is fairly well-known in one version or another. It’s been called, among other things, cups and caps because of the visual image it suggests. The cup side is the buy projection, the cap is the sell. Both involve three bar formations—take your pick, daily, five-minute, whatever. The second bar has the extreme (lowest, highest) price. Sometimes the price in question is the low (or high for caps) and sometimes it’s the close.
In this version of cups, both the lowest low and the lowest close have to occur in the middle bar. Also, the lowest bar must be lower than the three lows immediately preceding it. This is a rather arbitrary rule intended to limit the number of times the formation is occurring mid-range. Ideally, the cup should be a bottoming indicator, so think of the three-bar qualifier as a kind of running start setup. Caps are the opposite. Bar 2 must have both a higher high and close than the surrounding two bars and a higher high than the previous three. Figure 15.1 highlights our version of cups and caps within a daily chart of the 30-year bonds.
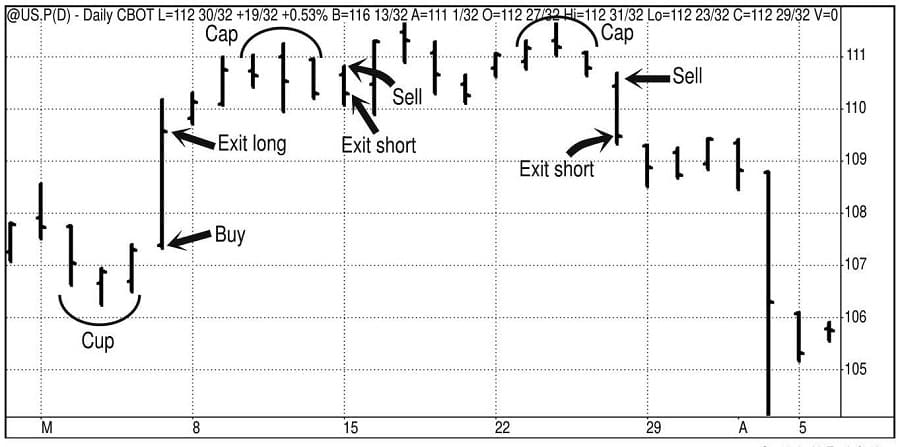
We can use this formation as another tool in our daily arsenal. Buy the next opening after a cup has formed, sell short after a cap. Exit on the close. Table 15.1 shows the results.
There is another cups-caps application that has a more universal bias than probably anything we’ve uncovered to date. The formation’s greatest predictive power lies in its overnight expectations. If you enter a cup on the close, you’re likely to get a higher opening the next day for an exit point and vice versa for a cap. Figure 15.2 is a visual sample typifying how, more often than not, the next openings will be favorable.
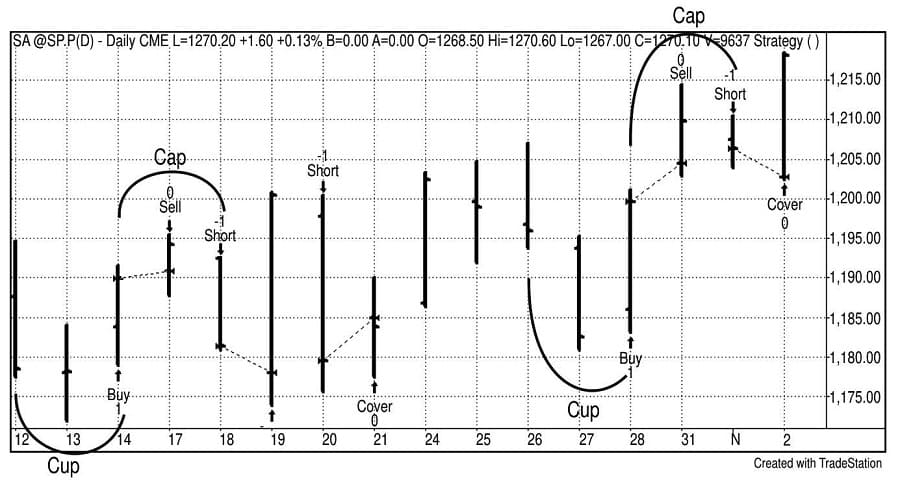
There will be occasional borderline circumstances where you won’t be sure if the close is high or low enough to technically qualify, but such mistakes can generally be corrected quickly without a problem. The overnight sessions are now commencing shortly after the close of the regular markets.
As we’ve stated, the key to fortification of an idea is seeing it conform to a variety of environments. Usually we ask that a financial holds up to some degree in most other financials and fairly well in related markets. It’s not generally a requirement that they also perform in agriculturals or exotics, for example. As always, though, we’ll be happier with more corroborating evidence than less, and in that respect, cups-caps comes through indeed.
Advanced Books and Courses on Price Action Trading


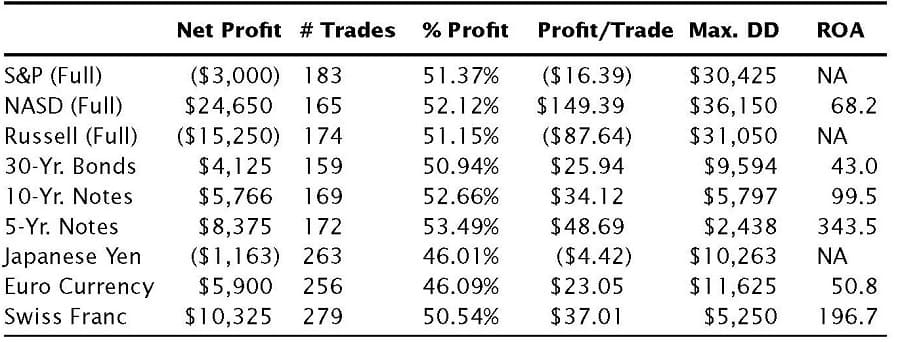
We’re scanning many markets for this study as well as a lengthy history. The study encompasses entire contract histories for most markets. In the case of the longer-standing ones, 20 years are referenced. All have a last date of 11-19-05. (See Table 15.2.)
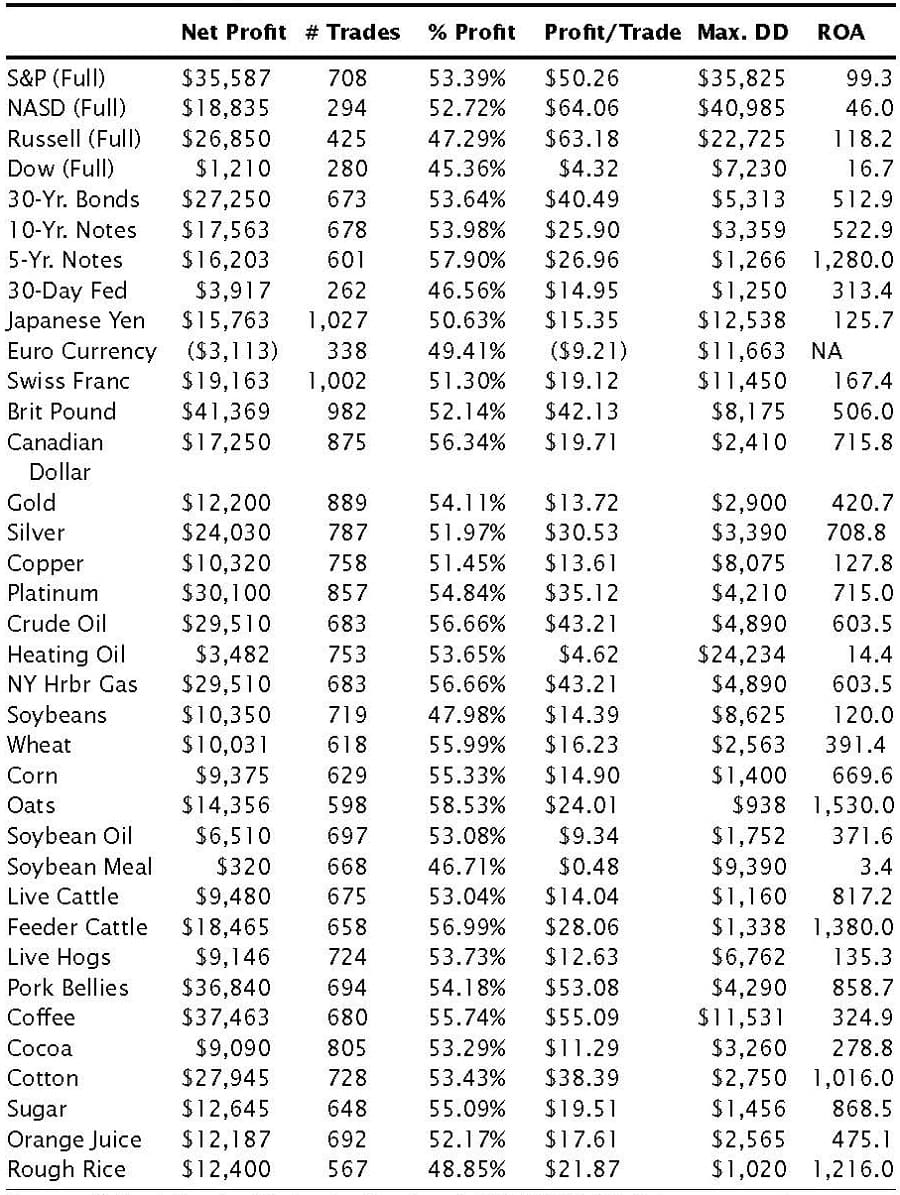
As you can see, out of 36 commodities tested, only the Euro currency posted a negative result. The vast majority of percentage profitability returns exceed 50. We’ve included thousands of trades in every major market sector over significant time frames. We’ve gotten consistent results—no bun-chups anywhere we look. Talk about robustness!
Unfortunately, you may notice something else. The profit-per-trade figures are probably too skinny to lend themselves to a broad mechanical application. Almost none even approach the conventional $100 per trade we need to budget for. Most of my mechanical associates consider this to be the end of the story—if you can’t overcome trading edges, you don’t have anything. I just can’t seem to let go of these broad robust biases, though. If opening-closing ranges were not prohibitively wide and uncertain and if you could average close to the posted opens and closes, undeniably you’d rule the world.
We’re talking microns away here—is there no way to nudge it some-how? The obvious key would reside in the overnight sessions. I’ve done some research into how often you can get in a tick or two better than the official close, and how well that does to overcome the runaway evening where you can’t. We’d need to somehow quantify how to deal with those missed trades. Do we just skip those trades, which obviously figure to be among our biggest winners—and hope we can make it up in our majority tick-or-two better days? Do we go to market after a certain time period? I don’t have the answers, but I can’t let go of the questions. Someday, I’ll return to this full-force.
For now, there are alternative strategies that can get us even closer, at least in some of our key markets. Table 15.3 shows the results of an alternate of the original overnight strategy that keeps the trade alive beyond the next open. On the day after your entry-on-close, you’re looking to exit at rather traditional profit targets and stop losses. If you’re long, the objective is the highest three-day high plus a quarter of the three-day average range. The stop loss is one tick under the three-day lowest low. If neither side is hit, you exit on the next (Day 3) open. Vice versa for sells.
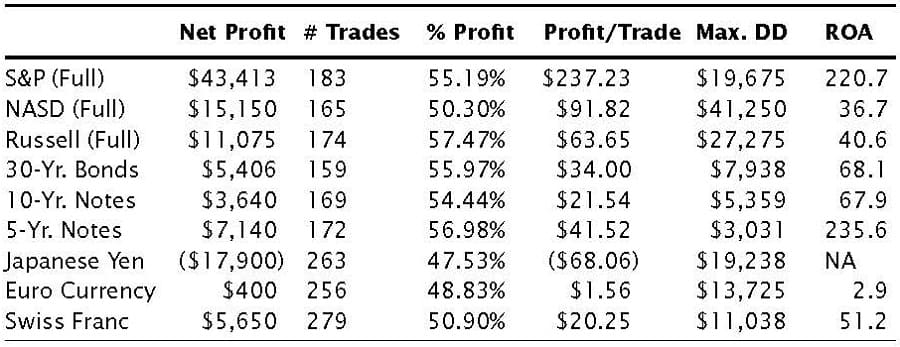
We’ve considerably improved our performance in the indexes to the point where we’re knocking on the stand-alone system door. The S&Ps are beyond their $100 per trade threshold and the NASDAQ is just shy of it. All the other markets are confirming save the yen.
We’ve seen much overall persistence in the cups-caps concept, which justifies our spending extra time on it. For even further fortification, check out 10 year periodic breakdown in each of the index markets. As we’ve seen before, they tend to provide especial opportunity. What’s more, they’ve been doing so for many years on a rather consistent basis. (Tables 15.4–15.6).
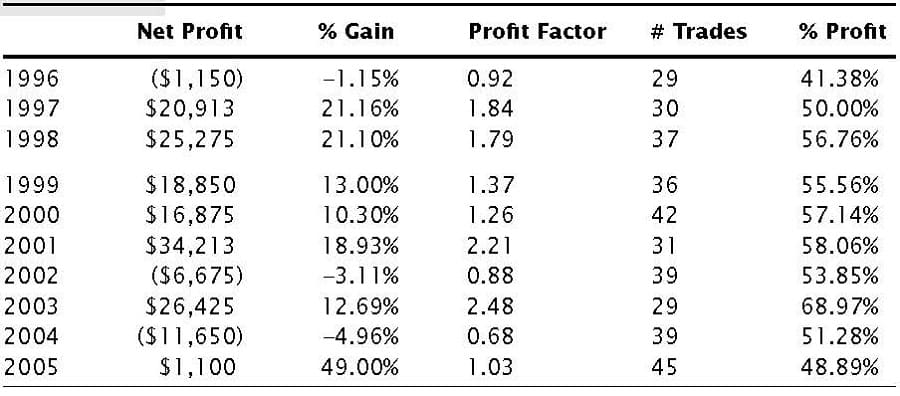
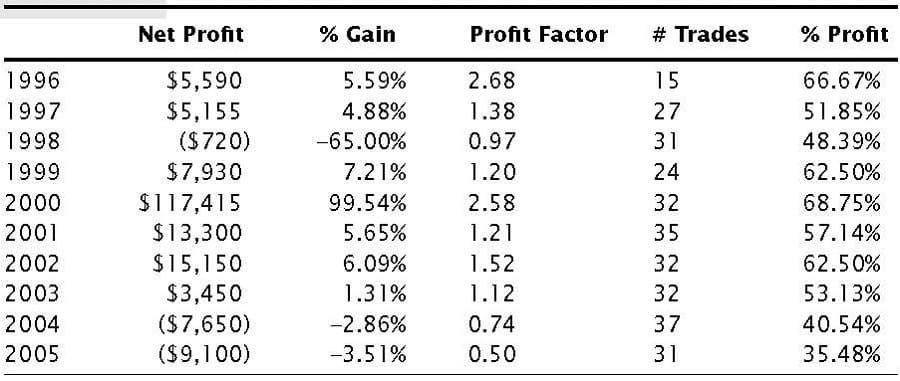
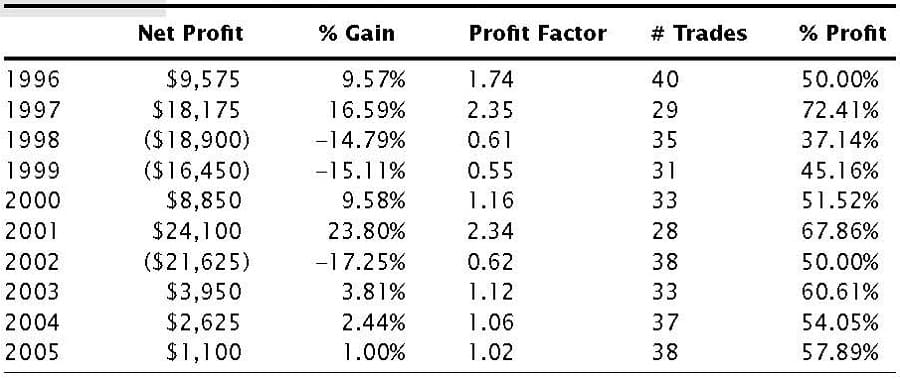
Table 15.7 summarizes the indexes’ total 10-year performance. You might note that some of the profit-per-trades are sizeable. In this context, we could be thinking in terms of definite stand-alone systems. On the other hand, I tend not to get more enthusiastic just because further back performance added to the mix creates overall better numbers, particularly given recent history.
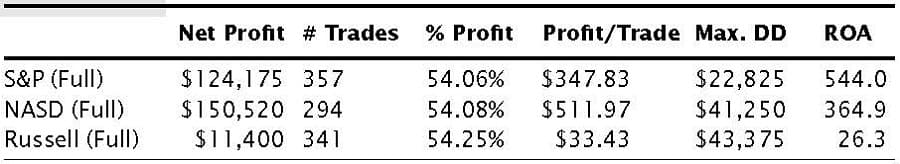
As we’ll shortly discuss in more detail, good results will inevitably spring from the expansion and bursting of the millennial stock market bubble (98-01-ish). Since we don’t know when the next anomalous wave of hysteria will hit, we should regard such over-performers with some skepticism. Still, it’s always better to have earlier data affirm rather than contradict.
- Part of Book: Beating the Financial Futures Market By Art Collin