Trading Articles
Crude Oil And Candlesticks By Gary S. Wagner
The rise and fall of oil prices have a global effect on all aspects of the markets. Here we look at this historical price movement through the eyes of candle patterns. The underlying psychology of market sentiment is a complex structure. It is difficult to understand and more difficult to explain. Fundamental analysis can be best expressed through words, interpreting how new information might bring about change in market price, while technical analysis uses mathematics to explain price movement. All market analysts distill information from which they formulate their assumptions. The master market technicians will use a mixture of both for successful trading.
What we call Japanese candlestick charts and patterns are the results of a trading system created hundreds of years ago and refined into its current form. The Japanese technician was one of the first to describe market sentiment as a battle between the bulls and bears. The outcome of the battle can be mathematically expressed as a single candlestick.
Trader’s Attitude
The candlestick technique teaches us to identify the trader’s attitude about the market. It is one of our earliest attempts to explain how traders believe a market will act. These patterns are the culmination of the original concept that over time were turned into identifiable patterns. By learning to identify these patterns, you can discover a systematic approach to recognizing both trends and reversals of the price of any stock or commodity.
The formations identified in candlestick patterns are based upon the sakata method, derived from the 160 rules that Sokyu Honma, credited to be the developer of the candlestick technique, created to guide his trading, as revealed in his work, The Fountain Of Gold: The Three-Monkey Record Of Money. He suggested that traders’ emotions have a considerable influence on price. This is where he suggested using the characteristics of the famous three monkeys:
- See no evil. When you see a trend, do not assume the continuation of its direction; it could be an opportunity for a reversal.
- Hear no evil. When you hear news, do not trade on it.
- Speak no evil. Do not discuss what you are about to do in the market.
It is from this work that candlestick charting and their patterns originate. Honma first wrote of the sakata five-method, five pattern groups based on the number three: Three mountains, three rivers, three gaps, three soldiers, and the three method. Over time these concepts evolved into the candlestick patterns taught to traders today.
The Basics
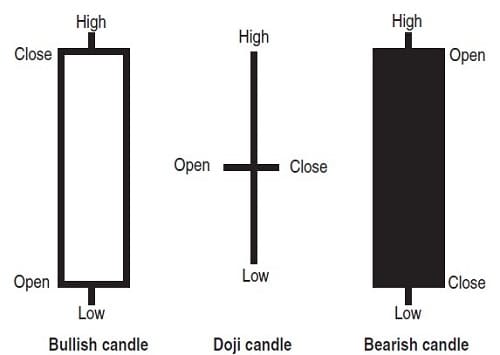
Candlesticks create an image of the outcome of the battle during a trading session. There are three possible outcomes of each battle: a long candle session, a short candle session, and a consolidation session. For long sessions, the following rules apply: There must be an above-average trading range between the opening price and the closing price. If the market closes higher than it opens, it is considered a bullish candle. If it closes lower than its open, it is considered bearish. If it closes at or close to the open, it indicates indecision.
The latter would indicate a possible top or bottom if found during a defined trend. The range above and below (high and low) the real bodies is called the wick (Figure 1).
Small sessions are where the range between open and closing prices are below average in relation to the preceding candles. They show a trading session where neither bulls nor bears dominate the outcome. Thus, they are considered to show indecision in the market (Figure 2). Small-session candles can also become either stars (spinning tops or doji found at market tops and bottoms) or umbrella lines (small bodies at the top or bottom of a long candle wick).
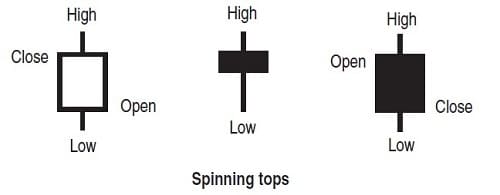
FIGURE 2: SHORT SESSIONS. The range between the opening and closing prices is smaller than in the preceding five to 10 days.
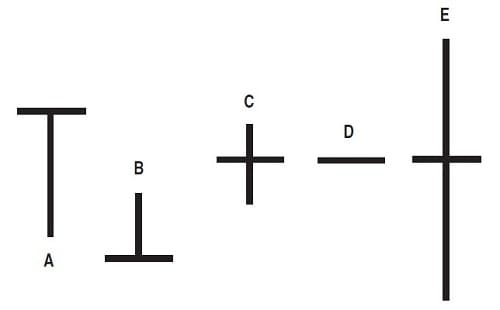
Doji sessions are where the open and closing price are the same, or close. They show a trading session where neither bulls nor bears dominate the outcome. When found after a long defined up- or downtrend, they can be a pivotal point to an eminent trend reversal (Figure 3).
One Part Western, One Part Eastern
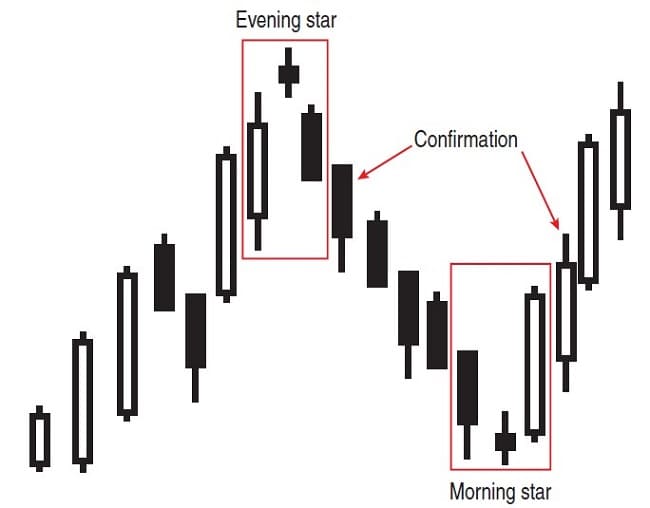
When trading with Japanese candlestick patterns it is essential to filter them with western technical indicators. This will allow you to sift out most false signals. I recommend using moving averages and trendlines as the primary filters. Take bullish reversals when it breaks above the moving average. Take bearish reversals when they break below the moving average. The more aggressive trader can enter the trade when the pattern is confirmed on the following candle (Figure 4).
Trendlines (Figure 5) will allow you to define support and resistance levels for reversal points and stop placement. Take bullish continuation signals above support lines (Figure 5, point A) and bullish reversals when the price breaks above the resistance line. Conversely, take bearish continuation signals when they trade below resistance lines and bearish reversals when the price breaks below support.

Candlesticks And The Crude Oil Market
One of the most volatile markets over the last year was crude oil. Not only did we see it move to record and contract highs, but we witnessed defined long-term trends, both bullish and bearish. The rise and fall of oil prices had global effects on all aspects of the markets. We will look at this historical price movement through the eyes of candlestick patterns. Figure 6 is a weekly chart of Brent crude oil. During this time period, oil moves from about $70 per barrel to a record high above $140, and then down below $40 in January 2009. The chart shows some strong and de-fined candlestick patterns signaling the correct path for the trader to take.
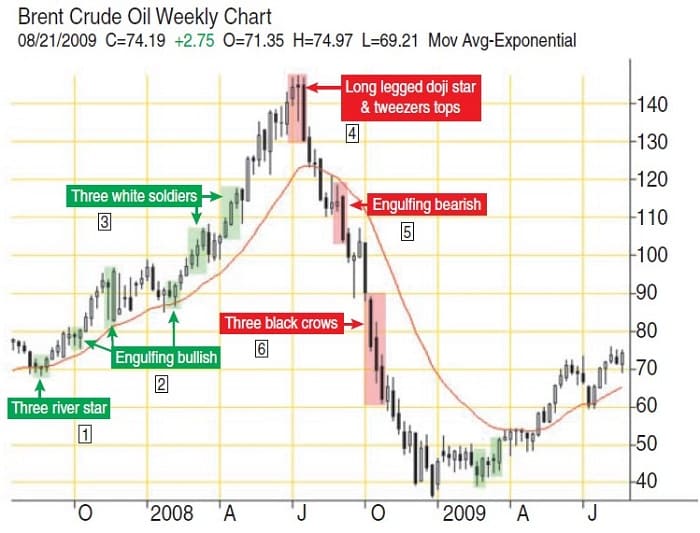
A three-river morning star pattern can be found in mid-August 2008 (area 1). The three-river morning star pattern formation occurs during a downtrend. The support is found at or near the low of the star candle. Traders taking this signal could enter long after the morning star confirmed on the following candle. This is the starting point for our trend support lines (Figure 5, A1).
Suggested Books and Courses About Candlestick Patterns
Over the next five months, the market started its historic climb, showing no signs of any major retracement. Three engulfing-bullish patterns appear during that time (Figure 6, area 2). The first and third of these engulfing patterns are followed by confirming candles (Figure 4). The candle following is white with a higher high and higher low. Because these patterns occurred after a defined uptrend, we would use this information as a sign that the trend would continue. If the engulfing pattern was followed by a long black candle with a lower low and lower high, it is called a last engulfing pattern. It can signal market exhaustion if found after a major uptrend. The last engulfing bullish pattern represents the bull’s final attempt to drive the market higher, but fails to do so.
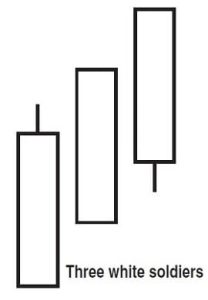
Figure 6 (area 3) exemplifies a bullish continuation pattern that shows extreme market strength. With oil trading more than $90 per barrel again, we see the first of two occurrences of a pattern known as three white soldiers (Figure 7). From the sakata method this pattern is an extremely trustworthy pattern. This formation represents vigorous buying. According to candlestick expert Steve Nison, “for this pattern, trend is not critical. The soldiers may begin an upward climb out of a downtrend reversal or may emerge during a rally.”
The market continues like a runaway train, making new contract highs for the next four weeks. It tries to consolidate, even forming a doji, only to be engulfed by a large white candle pushing it to new highs, closing at $140 per barrel. It will make one last push higher on the following week. Opening above $140, traders will push the market toward $150 (candle 1 in area 4 in Figure 6).
What Goes Up Must Come Down
The fi rst indication of a top comes after the fi rst candle in area 4 in Figure 6. It is a combination of a doji candle and two patterns that point to the end of the largest rally in the history of oil. A long-legged doji appears in the star position to create a doji star, which can denote the point at which a market hits a top or bottom. A pattern called tweezers tops is also present. This pattern occurs when you have equal highs and indicates market resistance. The last candle in this pattern group also cannot make a new high and closes below the previous three candles. This bearish black candle confi rms the doji star and the tweezers tops’ bearish prediction. We have reached the market summit. On the following week it opens above our major support line (Figure 5, point A) but then breaks below it, signaling a sell (Figure 6, area 4).
The market begins a freefall, which will set in motion the greatest price drop ever in crude oil. For the next fi ve weeks, the market will trade with a lower low and a lower high than the proceeding week. It will break below three of the four support lines (Figure 5) in one month. The market will break through all of the support lines created from the upward move in the following three weeks.
Two small-bodied candles appear only to be overtaken by another huge drop in price. Figure 6, area 5, shows the market now approaching $100 per barrel, with a black candle engulfi ng the two previous weeks. As the price drops below 100, a short-term rally tries to rise back above this mark, only to fall through this price with increased momentum. It breaks through this critical price point, which many traders thought would be support, and the selling accelerates.
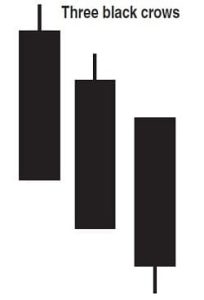
In Figure 6, area 6, you see the three black crows pattern (Figure 8). In three weeks, the market will drop another $30, to almost $60. The three black crows is the opposite of three white soldiers. It consists of three consecutive long-bodied black candlesticks that have closes lower than the previous session, with each session’s open occurring within the body of the previous black candle. A small rally occurs on the following week, only to be followed by a drop to just under $40 in December 2008. It will not rally again until January 2009.
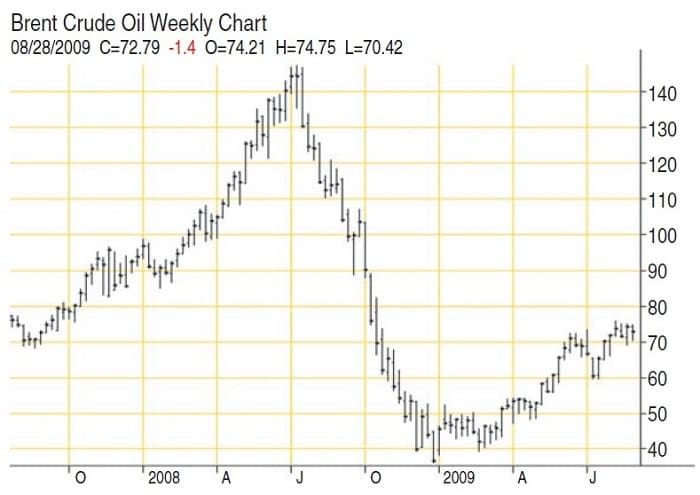
Figure 9 is the same chart expressed as a Western bar chart. The information is the same, but it simply does not give you the same visual information that the candlestick chart does. After more than 20 years studying Western and Eastern trading techniques, I am certain the knowledge and use of candlestick patterns will improve your trading. It is as accurate and articulate in mathematically describing market sentiment as any forecasting system developed since. It is just as relevant as it was when it was first created. When combined with classical Western technical analysis, it can lead to market insights that can only be gained by combining these methods.
Gary Wagner has been a technical market analyst for more than 25 years. He is the coauthor of Trading Applications Of Japanese Candlestick Charting and has also codeveloped software applications for market forecasting.