Trading Articles
Cross-Currency Coefficients By Brian Twomey

How do currency pairs move in correlation to their US dollar counterparts? When we think about correlation coefficients between two currency pairs, we usually think about correlations among the major pairs against the US dollar such as the euro/US dollar (EUR/USD), British pound/US dollar (GBP/USD), or their direct opposites, US dollar/Swiss franc (USD/CHF) and US dollar/Japanese yen (USD/JPY). One topic not mentioned in the research was the correlation among currency crosses that directly correspond to their US dollar counterparts. How these pairs move in relation to their USD counterparts will be the subject of this article as well as the Pearson product moment coefficient to determine how to factor various correlation coefficients.
CORRELATION OF CURRENCY PAIRS
When we measure correlation, we are measuring strength and direction of a linear relationship between two random variables, in this instance two currency pairs. Pearson’s product moment coefficient is the most popular factor because it measures an absolute value from -1 to +1 of a pair by dividing the covariance of two variables by the product of its standard deviation. Absolute value in this case refers to the measurement of distance as measured on a number line, and hence negative and positive values. In one instance, we are measuring X and Y slopes in terms of the absolute values. Knowing absolute values of a currency pair will almost answer the question of how far a pair will move in relation to its counterpart based on an X,Y slope.
To specifically determine an exact location of the X and Y plot where prices are located at any time, use the correlation of determination. An absolute value of +1 says a pair has a direct correlation, and an absolute value of -1 implies a negative correlation. But currency correlations rarely reflect a perfect relationship. A correlation coefficient that is in the high 80s or low 90s can be considered to be near perfect when the relationship is positive and a coefficient in the 20s to 30s can be considered to be negatively correlated. For example, based on September correlations, we know that EUR/USD and the Australian dollar/US dollar (AUD/USD) have a monthly absolute value of 0.74, a three-month absolute value of 0.76, and a six-month absolute value of 0.72. This positive relationship means in terms of USD that the EUR and AUD will move together 74%, 76%, and 72% of the time for the next six months.
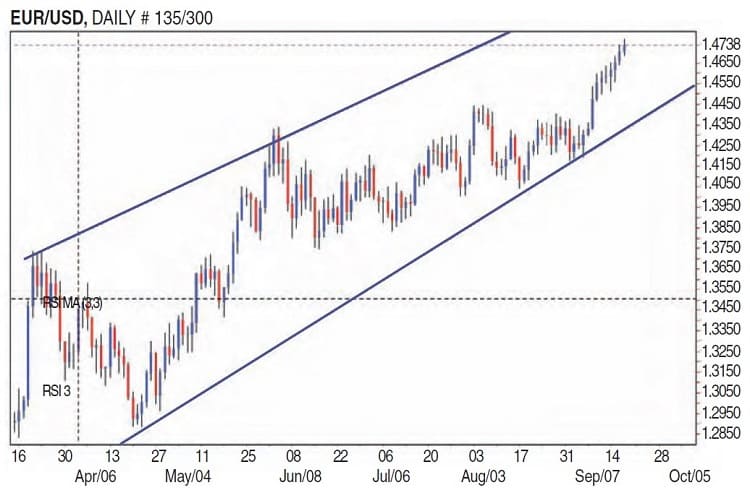
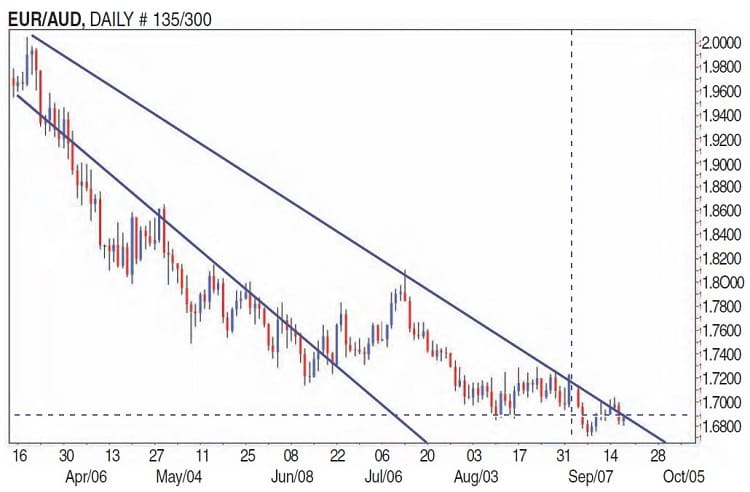
What these absolute values mean in terms of currency crosses is quite different. Which way will the EUR/AUD move in terms of its EUR/USD and AUD/USD counterpart? From Figures 1 and 2, you can see that the relationship is negative and in direct contrast to its USD counterpart. So if the euro and the Australian dollar move together 70% of the time against the US dollar, it has to have a negative correlation against each other and will sell off 70% of the time as the EUR/USD and AUD/USD move up. So as the EUR/USD and AUD/USD move down, the EUR/AUD will move up.
The EUR/USD and GBP/USD are well known for their positive correlations. For September, the absolute values are 0.75 for one month, 0.73 for three months, and 0.66 for six months. But these correlations are against the US dollar. How would EUR/GBP correlate against this US dollar relationship? If both pairs rise with the USD, they must be negatively correlated against each other so the EUR/GBP will sell off 70% of the time as the EUR/USD and GBP/USD rise with the USD.
WHEN THEY ARE NOT VERY CORRELATED
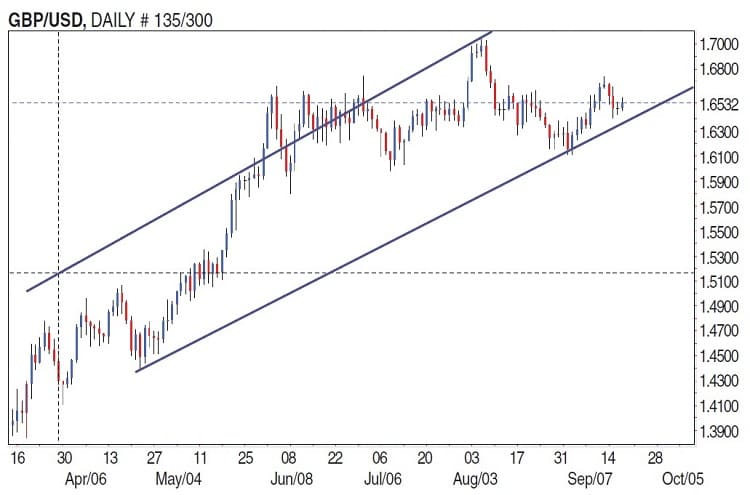
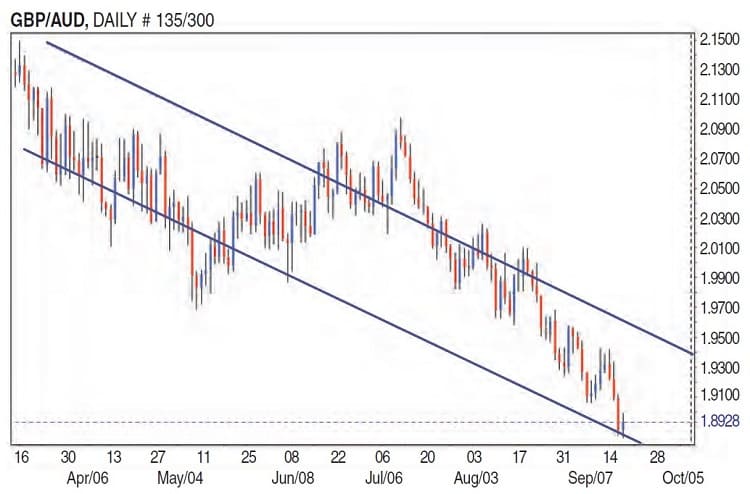
What if you have two pairs not so closely correlated, such as the GBP/USD and AUD/USD? The absolute values are 0.58 for one month, 0.73 for three months, 0.70 for six months, and 0.61 for a year. What does this correlation say about the GBP/AUD and how would you look at this trade knowing these two pairs normally correlate? The GBP/AUD for September is going no-where and will probably trade in a small range because the correlation is not positive or negative in terms of absolute values. In terms of correlations, this is an uncertain pair, especially when its immediate counterparts signal uncertainty. So looking at the GBP/USD (Figure 3) and AUD/USD for the direction of GBP/AUD (Figure 4) is not the place to begin.
Another option may be to look at yen crosses. Suppose we know the GBP/USD is negatively correlated to the USD/JPY based on these September absolute values — -0.05 for a month, -0.12 for three months, and -0.07 for six months and +0.16 for one year. Which way will the GBP/JPY move and how should you look at this trade in terms of correlations and absolute values? The best way is to factor the cross rates to determine where the pair is trading. For example, GBP/JPY is derived from GBP/USD and USD/JPY. So a GBP/JPY cross-rate is calculated by taking the cross-rate bid by multiplying the bid of the terms currency (top) by the bid of the base currency (bottom). For the cross-rate offer, multiply the offer of the terms currency (top) by the offer of the base currency (bottom). If GBP/USD rate is 1.6000 – 10 and USD/JPY yen rate is 100.00 – 10, then the GBP/JPY cross-rate is as follows:
- The bid would be 1.6000 x 100.00 or 160 yen per GBP
- The offer would be 1.60010 x 100.10 or 160.26 yen per GBP.
If you correlate the GBP/JPY to the GBP/AUD based on the absolute values of the GBP/USD and AUD/USD for GBP/AUD and GBP/USD and USD/JPY for GBP/JPY, we find those correlations to be negative. As the GBP/JPY sells off based on the one-month absolute value of -0.05, the GBP/AUD will rise based on the 0.58 absolute value of the GBP/USD and AUD/USD.
Suggested Books and Courses About Forex Trading
Visually, look at these two pairs, GBP/JPY and GBP/AUD. Subtracting the GBP aspect of this relationship leaves two base pairs that have negative correlations based on their absolute values. How do you know? AUD/USD to USD/JPY correlations are as follows: one-month correlations 0.08, three-month 0.04, six months 0.18, and one-year 0.48. This relationship doesn’t change if you inversely correlate USD/JPY to AUD/USD. The statistical figures remain the same.
WHAT DO CORRELATIONS TELL YOU?
What does the GBP/JPY and GBP/AUD relationship say to the EUR/AUD example? The GBP/AUD and the EUR/AUD should move in tandem because they are positively correlated based on their positive absolute values. But the EUR/AUD should move faster than GBP/AUD because the EUR/AUD is more closely correlated to the EUR/USD and the AUD/USD.
So if the EUR/USD and the GBP/USD both experience a selloff and the EUR/AUD, GBP/AUD, and EUR/GBP all rise, you can consider EUR/AUD, GBP/AUD, and EUR/GBP as US dollar pairs. To sell the EUR/USD and GBP/USD simply means you are selling the EUR and GBP against the US dollar. This means dollar pairs such as the USD/CHF, USD/JPY, and USD/CAD all move up as the EUR/USD and GBP/USD sell off. Likewise, the correlations of USD/CHF, USD/JPY, USD/CAD, GBP/AUD, EUR/GBP, and EUR/AUD all have absolute values aligned with the US dollar and move in tandem with each other. So a long EUR/AUD or EUR/GBP is a long US dollar position, which could be the same as USD/CHF, USD/JPY, and USD/CAD.
While statistical relationships may exist between currency pairs, many pairs are correlated to other factors such as the stock market and Treasury yields.
NONALIGNMENT OF ABSOLUTE VALUES
How would you look at opposite correlation crosses like the Gbp/Chf when absolute values don’t align? Gbp/Chf is made up of Gbp/Usd and Usd/Chf so maybe you want to triangulate these pairs using the cross-rate formulas. Absolute values align like this: For Gbp/Usd to Usd/Chf, absolute values are ‑0.64 for one month, ‑0.67 for three months, ‑0.57 for six months, and ‑0.45 for one year. Absolute values for negatively aligned crosses never correlate, so the direction must be determined using indicators, candles, and charts, especially if your answer cannot be found by triangulating these pairs using the crossrate formulas.
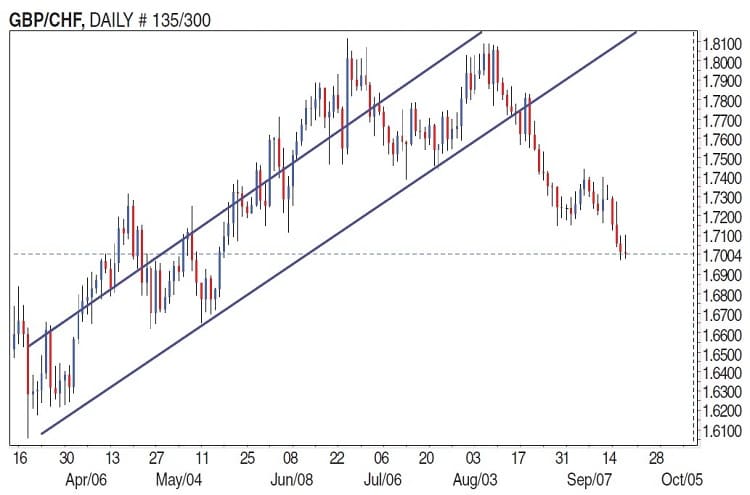
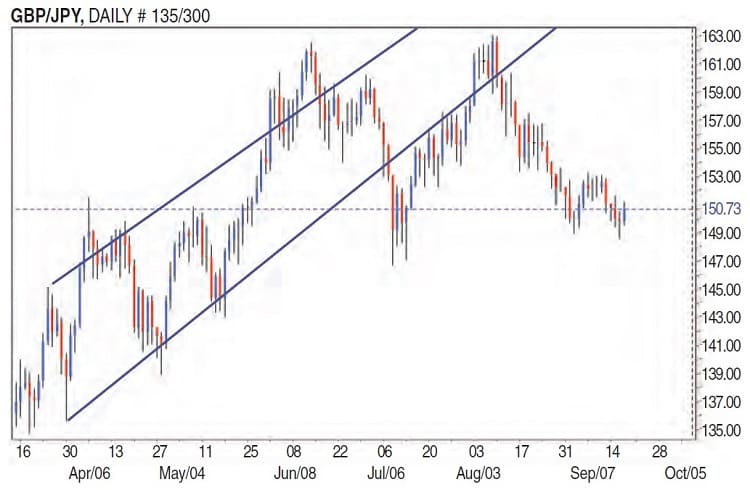
Another method to determine direction for Gbp/Chf (Figure 5) may be to look at other related pairs that have negative alignments such as the Eur/Chf, Aud/Chf, Aud/Cad, or even the yen pairs (Figure 6) since they all move in tandem with Gbp/Chf. Or look at pairs that have negative correlations for further confirmation such as Eur/Aud and Gbp/Aud.
The false premise regarding currency is that the US dollar plays no part in various cross-rates. But the US dollar is the beginning of all traded pairs and dictates all directions for all traded pairs. As long as the US dollar is the currency of exchange for traded goods and commodities in the world and the dominant reserve currency, it will always set direction for all currency pairs and their various crosses. So look to dollar direction by checking the US Dollar Index before choosing which pairs to trade.
MAKING YOUR TRADE DECISIONS
So can you execute trade decisions based on correlations and absolute values? The simple answer is it depends because correlations do have a tendency to change over time. These changes are caused by outside influences such as economic situations within certain nations’ economies, which way interest rates are heading within nations, the question of how much risk traders are willing to add, and changing central bank policies. In uncertain economic environments, traders may be willing to stay away from cross-pairs and institute safe trades such as straight USD pairs. A bombshell announcement like a collapsed housing market or a decision by a central bank to add massive liquidity to their economies would cause traders to bail out of cross and carry trade pairs, quickly leaving unsuspecting investors holding massive losses. So the question of risk must be a factored decision before contemplating any cross-pair trade.
Take the GBP/AUD example as our question of risk. Normally, these pairs have strong correlations and an interest rate difference between the two pairs at 2.5%. Yet because of economic uncertainty in Great Britain, coupled with a series of poor economic announcements, the correlations are uncertain in terms of absolute values. Even with carry trade potential to earn interest, traders are not willing to risk capital to these trades.
CHANGING MARKET CONDITIONS
When economic growth or potential for growth exists, absolute values will change and correlations will change with those values. Note the one-year absolute value between AUD/USD and USD/JPY. Today, that value sits at 0.48, yet the short term barely gauges a relationship. Is this a forecast for growth between these nations later or a forecast for growth for the region? There’s a possibility of a statistical relationship so far.
Know also that while statistical relationships may exist between currency pairs, many pairs are statistically correlated to other factors such as stock market moves, Treasury yields, risk indexes such as the volatility index (VIX) and option risk reversals. Interest rates are and always will be the driving force behind any currency trade, whether it is a cross or straight USD trade. So in uncertain economic times, traders are best advised to trade USD pairs and trade cross pairs when growth returns.
Brian Twomey is a currency trader and adjunct political science professor at Gardner-Webb University.