Trading Articles
Continuation Price Patterns By Alexander Sabodin

Take a look at some of the more common continuation patterns that you find on charts. Like reversal models (or patterns), continuation models are formed during periods of market instability. These appear when bullish and bearish forces are about equal. As a result, price stops moving in the direction of the trend and starts to fluctuate within a range. The appearance of continuation models usually indicates that the period of price standstill that you see on a chart is nothing more than a pause in the development of the prevailing trend.
The trend direction will not change after the consolidation period has ended. This is one feature that distinguishes continuation models from reversal models, which were discussed in earlier articles. Reversal models usually reflect a turnaround in the prevailing trend. Another difference between a reversal and continuation model is the duration of their formation. Reversal models, which tend to display crucial changes in price dynamics, usually last for a longer time, whereas trend continuation models are relatively shorter.
Continuation Patterns
Some of the common continuation patterns are triangles, flags, and pennants. Let’s look at each.
Triangles
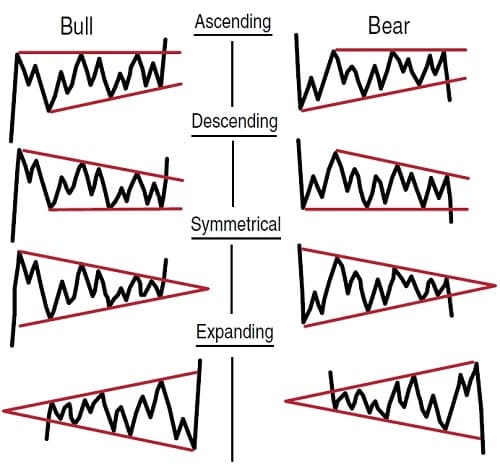
If the range of a price consolidation is limited within support and resistance lines and crosses either of them some time in the near future, the model is known as a triangle. Depending on how the support and resistance lines are arranged, you can have symmetrical triangles, ascending triangles, descending triangles, and expanding triangles (Figure 1). For the pattern to be valid, there must be at least two points at the resistance level and two points at the support level.
However, there are variations to this theory. Some prefer to see three points at the resistance and support levels. Although the triangle was originally accepted as a continuation model, today many analysts share the opinion that this model can be more appropriately described as neutral. What this means is that, as experience shows, a price breakthrough can occur in the direction of the current trend and against it. While you are working with any price model, your challenge is to wait till a clear price range is formed before you join the movement.
- Ascending triangles are formed when there is a horizontal resistance line and an ascending support line. This reflects a situation where demand is stronger than supply, or you could say that the bulls are stronger than the bears. When this type of pattern emerges, prices usually break to the upside.
- Descending triangles are formed when there is a horizontal support line and a descending resistance line. This reflects a situation where supply exceeds demand, or the bears are stronger than bulls. Usually, prices will break to the downside from a descending triangle.
- Symmetrical triangles occur when the upper triangle line is descending, while the lower line is ascending. The symmetrical triangle demonstrates a temporary equality of the strength of the bulls and bears in the market. Price is usually broken in the direction of the previous trend.
- Expanding triangles are a mirror reflection of these triangles and show increased volatility in the market. Market participants are seized with their emotions, but there is no apparent prevailing trend. It is the most difficult type of triangle to apply while trading.
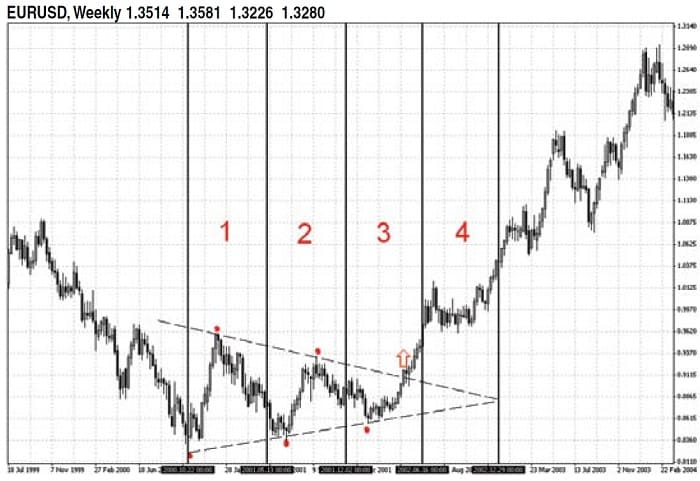
In ascending, descending, and symmetrical triangles, as the range of price fluctuation gets narrower inside the triangle, it is typical for trading volume to decrease. For expanding triangles, as the price range gets wider, volume usually decreases. However, after breaking out of the pattern, volume must increase significantly. When price retraces, volume will decrease and it will increase again when the trend resumes. It does take time for the model to complete. This time is determined based on the point at which the two lines converge. As a rule, the price breakthrough should be in the same direction as the previous trend, at about half to three-quarters of the distance of the horizontal distance of the triangle (see Figure 2).
If prices remain with the triangle beyond the three-quarters distance of the triangle length, that suggests the pattern is beginning to lose its potential. It could mean that prices will continue their uncertain movement all the way to the tip of the triangle, after which they could even go beyond the limits of the triangle. The triangle is completed when the closing price breaks one of the trendlines. Sometimes after a breakthrough, the price returns to the trendline. Depending on the direction of the trend (ascending or descending), this line becomes the support or resistance line, respectively.
There is an important trader’s saying: “A model must be seen with the naked eye.”
The triangle breakthrough can be considered complete when the closing price has gone beyond the limits of the consolidation line — that is, below or above one of the triangle sides. A simple crossing-over of the side of the triangle can often give a false signal. It is not uncommon to find that after a breakthrough of the triangle, price often moves back toward the broken side.
Suggested Books and Courses About Trading Charts


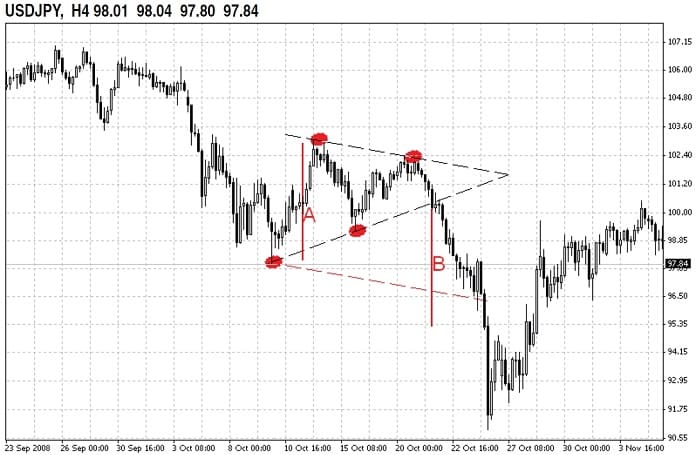
There are methods to measure the distance that prices can move after breaking out of triangles. The simplest way is to measure the distance of the widest part of the model (the base) and to set the distance either from the breakthrough point or from the tip of the triangle (top). Another method is to create a channel with a line parallel to the support line (for a bullish triangle) or resistance line (for a bearish triangle). You can see how both methods can be applied in Figure 3.
Flags And Pennants
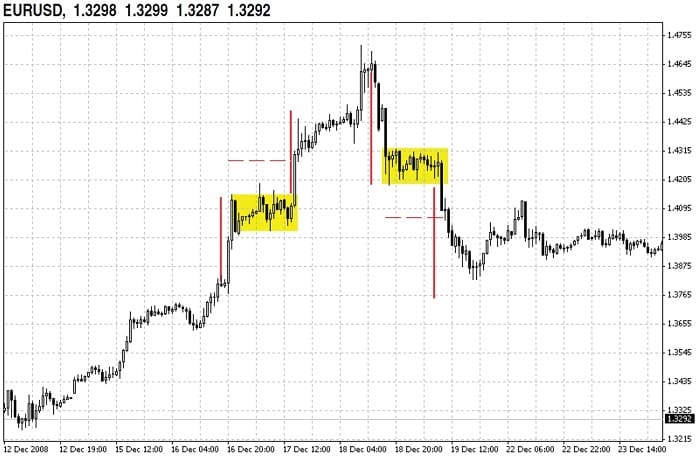
Flags and pennants mark short pauses in dynamically developed trends. The formation of these patterns on a chart should follow the steep and almost straight lines of the price movement. They are common in markets that appear to be overtaking themselves in their upward or downward development. They should therefore stop and rest before continuing their movement in the same trend direction. Flags and pennants are very similar in appearance. The flag looks like a parallelogram or rectangle, limited with two parallel trendlines that have a slope with respect to the direction of the prevailing trend movement. For example, if the trend is descending, a flag must be sloped slightly upward. If the trend is ascending, a flag must be sloped slightly down-ward.
The pennant is distinguished by two converged trendlines and a more horizontal layout. In fact, the pennant looks like a small symmetrical triangle. The formation of flags and pennants are accompanied with a gradual reduction in trading volume. But after the breakout from support or resistance, volume sharply increases (Figure 4).
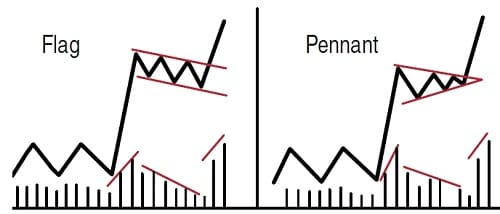
Sometimes you may come across the flag “cloth” inclined toward the direction of the trend. In such cases, the predicting strength of the pattern is reduced and a trend reversal frequently occurs as opposed to a continuation. When the flag with cloth appears to be horizontal, that flag is referred to as a rectangle. Calculating the expected price movement after the breakout of a flag or pennant is relatively simple. The most conservative estimates are similar to those of triangles: a flag cloth is already a channel, and for the pennant you can use the widest point as a reference point. The width of the flag or pennant will give you the minimum price move you can expect after the breakthrough. The most optimistic estimation is based on the assumption that flags and pennants fly up from the flagpole to half the length of the flagpole. This means that such trend continuation models usually emerge at approximately the middle of the entire price movement (Figure 5).
In discerning price models, there is the danger of seeing them more frequently than they exist.
Practical Aspects Of Price Models
Always remember that with the exception of the thorn, any pattern is a pause in the movement. As traders, we wonder:
- Where will the price move to after the pause?
- How intensely will price move after the pause?
A breakthrough of a price model means a breakthrough of a resistance or support line. If you can visualize price flying out like a cork from a bottle of champagne, it reveals that the market has chosen its direction. The intensity of the movement can be determined by its speed — that is, the distance moved in points divided by a time unit or by the candle body after a breakthrough of a candle formation. If the body is big, it means that the breakthrough is confident. If the candle has a small body or big shadows, it means that there is no obvious certainty.
When studying different price models, it is always a good idea to keep an eye on support and resistance levels. That is more important than trying to predict price targets according to a price model. If price hits a resistance/support level while it is on its way to an anticipated price target, it is better to take your profits at the resistance/support level or move the stops based on these levels. In discerning price models, there is the danger of seeing them more frequently than they really exist. As you gain experience, you will be able to turn this subjectivism in your favor. You should only apply those price models, which can be used with success. Finally, there is an important trader’s saying you should always remember: “A model must be seen with the naked eye.”