Trading Articles
Comparative Trading Volume By Anthony Trongone

This article looked at how price action can be used to anticipate future price movement in the S&P 500 SPDR exchange traded fund. This time, we add trading volume to the mix, but not in the typical way. As technicians, we depend primarily on two variables to augment our predictive ability: price and volume. In my previous article, the emphasis was on using yesterday’s action to determine the price movement of the Standard & Poor’s 500 depositary receipt (SPDR) exchange traded fund (SPY), also known as spiders, over the next three days. This time, I combine two independent variables: a price change in the spiders together with trading volume, but using volume in a less conventional way.
Most market participants assess trading volume by comparing today’s activity against a 20- or 50-day moving average, but they aggregate trading days without making allowances for the strength or weakness of price movements. In this article, I measure yesterday’s trading activity in conjunction with a percentage movement in the price of spiders.
TRADING VOLUME
In the 474 trading days under investigation, the average trading volume for the spiders was 234 million shares; therefore, a positive trading day with activity above this score is seen as bullish, but we are not accounting for yesterday’s price change. On those 37 days with a strong advance (a percentage gain at or above 2%), the average trading volume was 306 million shares; the watermark for those 37 days is 306 million shares, not 234 million. This article provides a way to correct this oversight by assessing those days with similar movements in price within each of the six pricing categories.
In order to perform this analysis, the price of the spiders is broken down into the same six categories as my previous article, but once I construct the percentage daily price change I delve deeper by separating each pricing category into above-average and below-average volume. Always consider the performance of an instrument under analysis before accepting the results of any trading system. In these 474 days, the spiders had a $27 profit. With this upward bias, they were capable of turning in a profit after an advancing or declining session. A decline, however, brought a return of $21.15 the following day, leaving less of a return after a profitable session.
WORKING HYPOTHESIS
Forecasting pundits generally agree that a rise in price accompanied by a rise in volume produces a bullish market, but bearish when trading activity is weak. Conversely, when prices fall in an environment of weak volume, this is seen as bearish, but bullish if trading activity is strong. If we subscribe to this traditional wisdom, it would produce the following hypothesis:
- A positive day with below-average volume is bearish
- A positive day with above-average volume is bullish
- A negative day with below-average volume is bullish
- A negative day with above-average volume is bearish
Consequently, we would expect the following results within each category:
- A positive day with above-average volume will outper-form a positive day with below-average volume.
- A negative day with below-average volume will outperform a negative day with above-average volume.
With this traditional concept framing the working hypothesis, after a positive trading day with above-average volume or after a negative day with below-average volume, when making an assessment of the next trading day, the spiders should produce more favorable results.
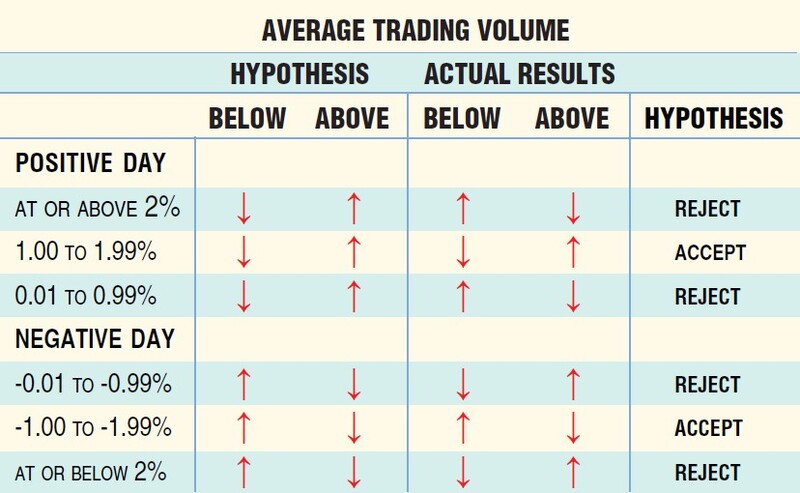
In applying traditional theory, an advancing day for the spiders with strong trading activity (above-average volume) should produce better results, as well as a declining day with weak trading activity (below-average volume). Although the analysis did support this hypothesis for the two middle categories, it fell short for both the strongest and weakest (Figure 1).
Relative to each category, there is more trading volume after a negative day for each respective price change category (356 to 305 million, 273 to 227 million); the smallest discrepancy was found in the weakest category (216 to 197 million) as you can see in Figure 2.
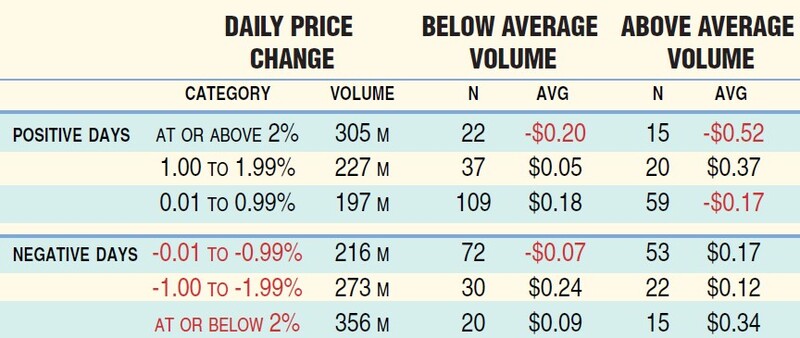
Although the day following a strong advance (=> 2%) gave back a good portion of its profits ($0.31 per day, n = 37 days), an increase in trading volume had more of a downturn (-$0.52 above versus -$0.20 below). Meanwhile, after a strong decline (<= 2%), the spiders were able to recover some of their losses. In doing so, the 15 days with above-average volume had a $0.25 advantage ($0.34 above versus $0.09 below). After reviewing the results of these two extreme categories, we must look at this theorem differently.
Suggested Books and Courses About Price Action
A moderate percentage advance in the spiders (1.01% to 1.99%) was supportive of our hypothesis. On a day with above-average volume, the following day had the better outcome ($0.37 to $0.05). Similarly, a moderate percentage decline was supportive of our hypothesis, as the 30 days with below-average volume had an advantage of $0.12 over the 22 days with below-average volume.
The weakest price movements had the widest discrepancies with different results. After a mild positive day, the spiders gave back $0.17 on days with strong activity but continued to provide back-to-back profits when trading volume was weak. After a mild negative day, the spiders were positive after displaying above-average volume, but negative when its volume was below average.
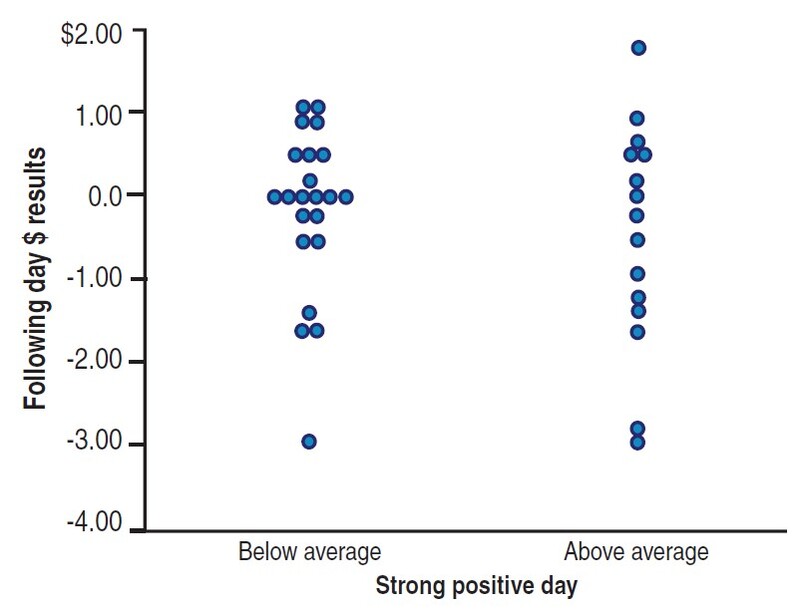
The dot scattergram in Figure 3 offers a side-by-side comparison of trading volume in the extreme positive category. The left side of the chart displays the performance of the spiders after a trading day with below-average volume. Although there are 22 dots, most noticeable is the cluster of nine scores with little movement on the subsequent trading day. Outlying scores show four days with an increase at $1.00, but it did produce three losses around $1.50 and a single loss of $3.00. In contrast, the 15 days with above-average volume (right side) had a wider range of scores; these single-line scores are a warning for the presence of volatility.
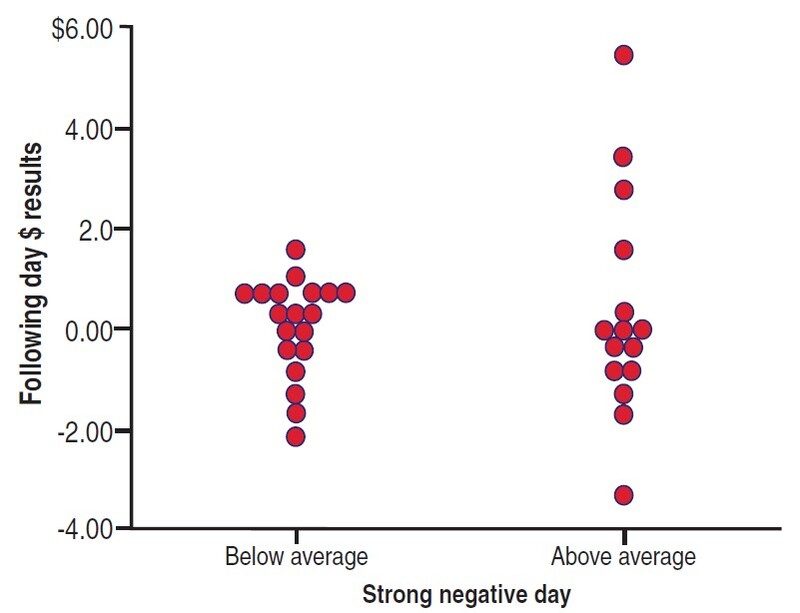
After a crushing loss with below-average volume, volatility was relatively low (Figure 4). The following day’s performance for these 20 days resulted in a profit of $1.76, with most of these scores residing around the dollar mark. On the other hand, the 15 days with above-average volume gave the investor back a return of $5.03, but most of these gains came from the top four trading days.
MOVING AVERAGES
Although the investing literature is replete with information regarding the virtues of using moving averages, this indicator does have its drawbacks. Figure 5, for instance, showcases trading activity but does not reflect an instrument’s change in price. The 20-day moving average of trading volume demonstrates some draw-backs of using a comparative system. For instance, the line chart begins with excessively strong trading volume (400 million shares) and weakens dramatically before making two peaks. Such disparities occur often and reflect current market conditions, seasonal holidays, or random shocks.
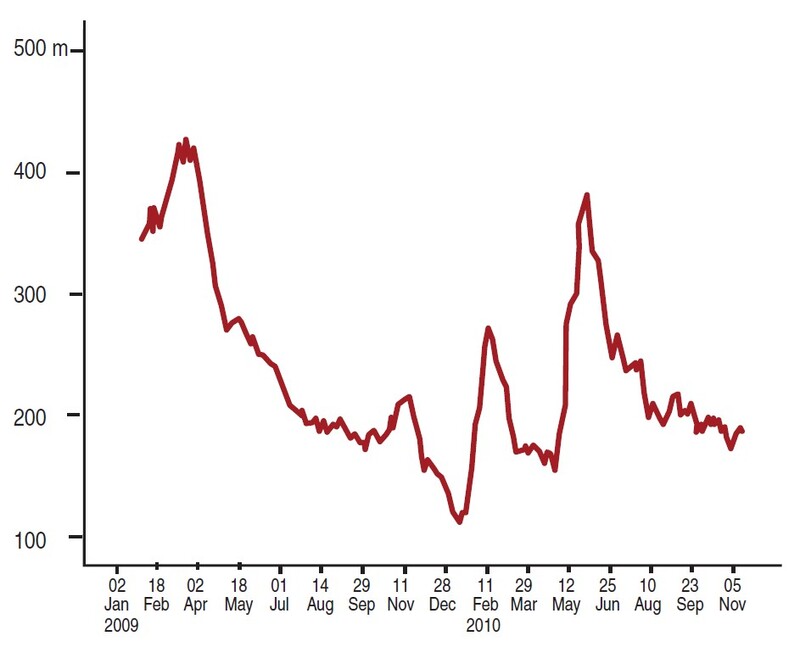
Nevertheless, there are plausible reasons for these sudden changes in volume. Since we are starting this investigation at the tail end of a bear market, this in itself can be a catalyst for excessive trading volume. As the market recovered, traders were reluctant to return to the market. In addition, it drifted down to 100 million shares because trading activity traditionally slows during the holiday season.
The sharp upturn in volume in May 2010 was the result of a $16.32 decline in the spiders. Generally, when prices fall sharply, it heightens trading activity. With all these variations in trading volume, some tinkering is necessary. Although these examples were on a long-term basis, you can confront a slowdown in trading volume on a daily basis.
Lackluster trading activity often occurs before the release of economic reports, a response from the Federal Reserve, or the earnings of a bellwether company. Conversely, after news announcements there often is a thunderous reaction, driving market participants to take positions. Such responses are common, and so, it is necessary for us to make adjustments in our average scores. When applying this system, you cannot take a hard-line approach. Using a 20-day or 50-day moving average will allow you to spot these trading anomalies.
SERIES OF LESSONS
For those seeking unambiguous results, deciding on how trading volume contributes to our market analysis may appear to be an extra and possibly unnecessary complication, but as we all know, trading is not an exact science. Examining how volume can play a part in anticipating market movement is most useful for those technicians who continue to refine their skills, stay ahead of the curve, and seek the edge that often makes the difference.
THE COMPLETE PICTURE
Although my previous article was instructive in itself, it did not discuss how trading volume affects each category. When comparing the performance of the spiders within each category, together these two articles paint a more complete picture of what we can expect. Although a comparative assessment of trading activity is a meaningful indicator, it is often a temperamental one. Some variations are not a function of the market; this requires a revision in your analysis. Do not overlook holidays, shortened trading days, or summer doldrums as a source of reduced activity. When you confront such situations, you may have to deflate your average scores in order to compensate.
The accuracy of this system can be improved by evaluating trading volume within the current market environment. You can accomplish this by drawing a moving average of trading volume using a range of time frames. Finally, when you are using trading activity as an independent variable, there are no concrete rules; some daytraders discount its efficacy as a predictive tool, but that is a mistake! Your success at using trading volume as an independent variable comes at an incremental pace, in which the technician is willing to participate in a series of lessons.
Anthony Trongone, has taught graduate courses in psychology as well as finance, investing for capital appreciation, and quantitative analysis in the US and across Asia. As one of 25 Master Educators for eSignal, he regularly writes articles on investment strategies.