Trading Articles
Haguro Candlestick Method for Support and Resistance
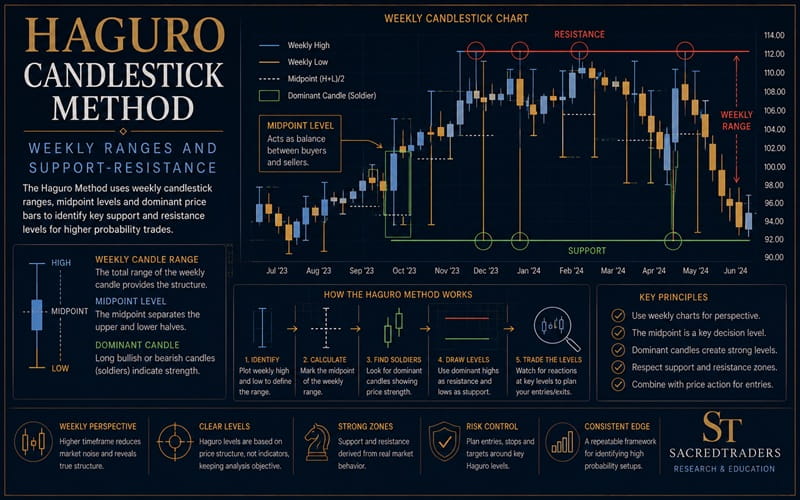
As technical traders, we must always consult the market. Here’s a method that sets clear support & resistance levels and can be used to trade futures, equities, and forex pairs. In this article I will attempt to give justice to the outstanding observations about market movements made by Seiki Shimizu in his book The Japanese Chart Of Charts. Shimizu’s text documents expected price movements following a particular candlestick shape.
Range Relationships
As technical traders, we must always consult the market about the market. This is the first tenant of any technical trading system. As Shimizu put it:
- We should look at the market movement itself rather than look at economic policies. The art of candlestick charting started in the late 17th century in the port city Sarkata during the 8th Shogunate period long before forward-looking economic policy was considered as an investing tool. The trader should look at market movements as the ebb & flow of a river of the greater market emotions. These emotions give rise to price formations and patterns that allow you to make decisions, like the cat waiting for the mouse to move. As the cat detects the minute movements of a mouse before it tries to run, so the trader should detect the minute movements of the market and make decisions before the market makes its primary move. The chart only reflects the past movements of the market, and no matter how long you look at the chart it is still correct to say you are unable to predict future prices. As far as wanting to try and predict future movements of the market, the observation of the chart comes closest to achieving this desired outcome.
A study of price movements and the associated psychology behind price movement is a worthwhile endeavor for anyone interested in the markets. Many books have been written about the shapes of daily candlestick bars—with all of the associated names like paper umbrella, hanging man, doji, and so on—and each shape’s implied effect on prices immediately following the candle. These observations do not apply to the weekly chart; they are the realm of the short-term speculator. However, future daily movements, while notoriously and difficult to predict on a 24-hour basis, give way to the much more fluid and predictable weekly price lines in the Haguro method.
Let’s look at the weekly price bodies and the relationship to the middle of the range. First, I’ll group the only possible outcomes of the weekly price line. The Haguro method of weekly price lines refers to the total range of the week, that is, the highest and lowest price traded during the five-day period. The psychology behind this is that the closing price on Friday is where the market has decided to settle after five days of trading. That price line high to low now contains the Monday opening price and Friday closing price. This is now shown as the body of the candle in green (Figure 1), where the Friday closing price was higher than the Monday opening price, and in red (Figure 2), where the Friday closing price is lower than the Monday opening price.
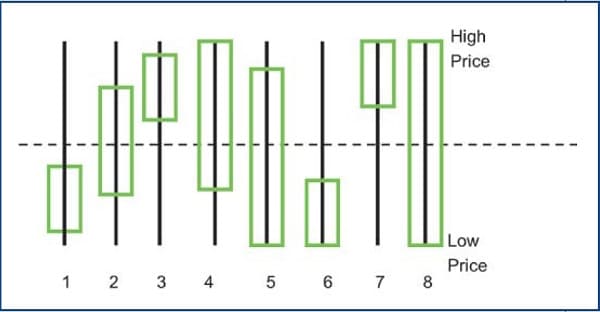
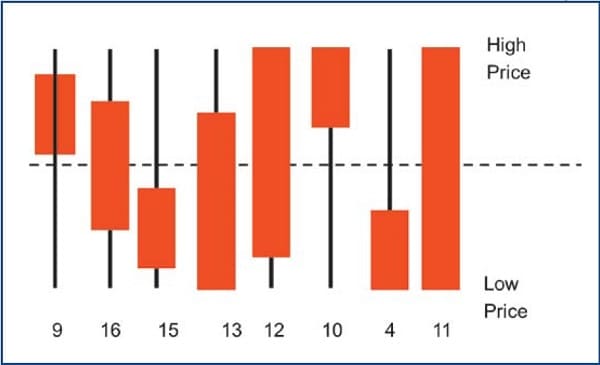
From these outcomes, the first observation is the placement of the open & close of the price body against the range of the week. The diagrams of the candlesticks in Figures 1 & 2 show that in some cases, the complete body is above the middle of the range (candle numbers 3 and 7 in green, and 9 and 10 in red). In candle numbers 1 and 6 in green, and 15 and 4 in red, the open & close of the body is below the middle of the range. The rest of the green and red bodies cover the middle of the range of the week. These are candle numbers 2, 4, 5, and 8 in green; and 16, 13, 12, and 11 in red. The only other possibility is when the Monday opening price and Friday closing price are the same. In such a scenario, the body is regarded as small but still viewed with respect to the total range of the week and its relationship to the middle of the trading range for that week.
It is important to note here that the weekly candle shapes do not have the same trading implication as the daily lines. This is one of the great misconceptions of candlestick charting. For example, you cannot view the candle number 8 as a marubozu strong candle when viewed on the weekly chart, since it could contain three gaps, including an exhaustion gap, when viewed in a daily time frame.
Advanced Books and Courses on Candlestick Patterns
Soldiers in The Battlefield
From the weekly candlestick ranges, the strong trading period is the one with the range and body that is visibly larger than the preceding weeks. That is the soldier guarding the area going forward.
The weakest part of a soldier is considered to be the midriff and if he is pierced there it’ll result in certain death. This happens on the weekly chart, when the Friday closing price pierces the middle of the range of a large candle in previous price movements. It indicates important support or resistance has been broken, and further price movement in the current direction should occur.
The strong trading period is the one with the range and body that is visibly larger than the preceding weeks.
This becomes powerful when trading in the direction of an established trend. You can place trading alerts in these areas to look for potential trade entries.
Applying the Haguro Method
In Figure 3 is a chart of General Motors (GM), which shows a closing high price being set at $41 in December 2013. I’ll walk you through the various numbered points labeled on the chart. At point 1 you see the first real resistance level of $40.30. It is set at the midpoint of the bearish week during the first week of January 2014. The following three weeks remained bearish, with the midpoint at point 2 set at $37.80.
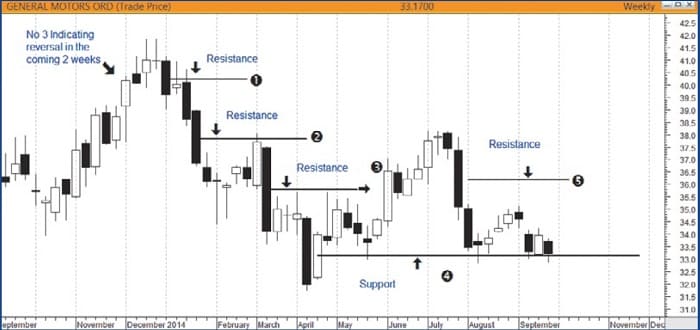
These trading ranges are relatively large and dominate the price ranges of previous weeks. During the month of February, the price rose to the midpoint at point 2 but failed to break above this resistance level, which set up further decline in price. Many buyers from the previous bullish week would be closing out losses at this level since prices didn’t break out above the resistance level. This results in the setup of the resistance level at point 3. In the following weeks, price hit a low of $32. On the week ending April 18, 2014, the weekly candle pierces this very bearish week, leading to a support level being set up at $33.10, which is point 4. Higher prices followed and with a revisit of the resistance level at point 3. But prices fell to test support at the $33.10 level, which held as prices moved up after touching this support level. This time, the resistance level at point 3 was clearly broken, and prices moved on to retest the midpoint resistance at point 2.
The support & resistance levels of the dominant Haguro candle will remain until they are broken. This can take several months or years. This is again demonstrated with the recent retest of the current $33.10 support level. Resistance remains at $36.25 (point 5) and $37.80 (point 2).
Where the candle shape shows up is important. Since the weekly chart is the sum of five trading days and has an important two-day break before the next trading takes place, the weekly candle can give an important signal to future price movement. For example, if you find the weekly shape candle 3 in Figure 1 in a high price area, it can give a warning of lower prices two weeks prior to a reversal. For example, the chart in Figure 3 shows a clear warning of a price reversal in November.
The Power of Haguro
The Haguro method of analysis has shown itself to be a robust method of setting support & resistance levels with simple clarity. I have used this method in my day-to-day analysis for many years (it is now available as a free add-on in MetaStock) and it continues to reveal its power in today’s volatile markets. Although it was developed for the futures markets, it has shown its robustness in equity and forex trading.
- Gary Burton is director of the Australian School of Technical Analysis, an independent educational facility for traders and investors, based in Sydney. A member of the Australian Professional Technical Analysts Association (APTA), he holds the accreditation of Certified Financial Technician (CFTe) from the International Federation of Technical Analysts (IFTA). He conducts regular workshops in technical analysis with his signature workshop being “The Candlestick Master” class.