Trading Articles
Market Reversal Timing Using Gann Vibration Inversion Points
Gann made millions in the markets by doing extensive historical research to determine how angles, numbers and astronomical cycles coincided with trend change dates. Much of this research was never revealed in Gann’s courses, and many believe that he placed his advanced knowledge in coded form in his published works. We do know with certainty that Gann believed the relationship between numbers and price cycles was the key to successful market trading. His research convinced him that in an unknown way these mathematical principles seem to cause the market to move toward given price targets within certain time periods. “If you wish to avert failure in speculation we must deal with causes. Everything in existence is based on exact proportion and perfect relationship. There is no chance in nature, because mathematical principles of the highest order lie at the foundations of all things, Faraday said, ‘There is nothing in the universe but mathematical points of force.”’
A few decades ago a scientist named John Nelson did years of research for RCA Corporation on the correlations between sunspots and the positions of the planets. He discovered that certain angular relationships between planets coincided with sun spot activity which would create magnetic storms on earth. By knowing in advance when these critical angular combinations would occur, it was possible to predict the disruption of terrestrial radio transmissions. Severe magnetic storms cause earth currents which affect undersea cables, telegraph lines and power transmission lines. Nelson published his findings in a book called Cosmic Patterns: Their Influence on Man and His Communications. His demonstration that these disturbances could be predicted based on planetary positions was revolutionary. In the same way, our forecast of the exact August, 1987 top of the Dow Jones Averages six months in advance was thought to be without substance, until it was proven correct. The methodology of this prediction was discussed in our previous article, Gann and the Planets.
We referred to a Newsweek article of August 17, 1987 entitled “The Harmonic Convergence” which stated, “It’s the first time in 23,412 years that nine of our planets will be aligned in a configuration called a Grand Trine (several 120 degree angles between the planets) which allows for an unprecedented amount of energy to converge in one place and harmonize with itself, creating an energy greater than any experienced on earth to date.” We pointed out why the all-time high in the Dow Jones Averages happened to coincide with this widely promoted planetary phenomenon.
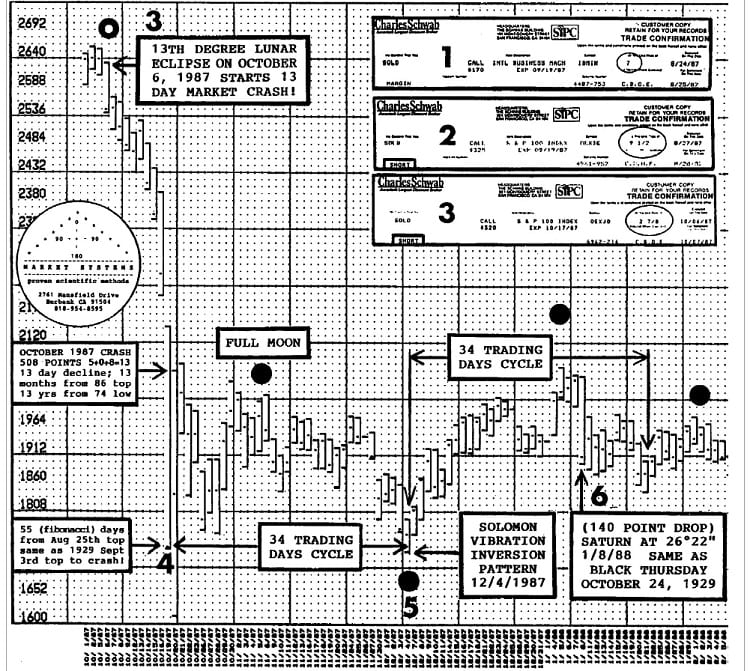
Some articles have recently appeared revealing that Gann used astrology to forecast prices. Although Gann used many astronomical correlations in his work, in many cases his interpretations of these cosmic patterns differed markedly from those of traditional astrology. He also gave to other astronomical data, such as planetary anniversary dates, a forecasting prominence which they never had before. For example, the 140 point drop (third largest in history) on January 8,1988 occurred when Saturn returned to the exact degree in the heavens where it had been on October 24, 1929, the infamous Black Thursday!
The body of knowledge sometimes referred to as “ancient wisdom” is based on the understanding of cosmic phenomena, geometry and the science of numbers. As a developed science, ancient wisdom does not proceed by trial and error experimentation, but relies on proven prior correlations between the eternal and temporal realms. The Elliott Wave, a relatively recent forecasting discovery, is partly based on the numerical progression of three, five, eight, 13, 21, 34, etc., ancient knowledge that was re-discovered by Fibonacci only centuries ago. As we pointed out in the article, “Beyond Gann: Biblical Cycles”, the use of these forecasting tools is illustrated in the architecture of the Great Pyramid in Egypt.
- Trades:
- Sold all long positions including IBM call options at the August 24, 1987 Harmonic Convergence top for 250 percent profit.
- Sold short September S&P 100 on August 27, 1987
- Again sold short on October 6, 1987 lunar eclipse! The October Crash has a similar pattern to the October 1929 crash, New moons and full moons often generate minor trend changes.
- The October 1987 crash low, a Fiboancci number.
- The 140 point one day drop occurred on 1/8/19888 when Saturn returned to the exact degree in the heavens where it had been on infamous Black Thursday 10/24/1929.
Despite the plethora of predictive techniques, no particular system has even come close to being a reliable indicator in all markets at all times. The problem is to know when each method will work, for which markets, and for how long. It is obvious that the different forecasting techniques only work some of the time. This is especially true for astrology, which has achieved popularity during the Reagan era as the new Messiah” of forecasting systems. As we shall show, when certain planetary “aspects” are applied to the stock market, they can have quite different effects than what we would expect based upon the interpretation of traditional astrology. Gann discovered that planetary cycles are excellent indicators, but they must be placed in the correct interpretive context in order to have predictive value.
Out of our research has evolved a unified set of market principles or laws by which the various predictive techniques can be ordered and prioritized. This is a holistic meta-synthesis of analytical methods, bringing different forecasting methods into relationship as part of one topological structure. This provides a “master key” to discern which forecasting techniques rule price patterns in particular time periods. We call these market forecasting laws the “Genesis Principles” because we believe, with Gann and Plato, that they are the original “Forms” or “Patterns” by which the material realm is structured and ordered. In addition, the Genesis Principles express the vibratory nature of creation itself: “In the beginning God created the heaven and the earth. And the earth was without form, and void . . . And the spirit of God moved (vibration) upon the face of the waters (Genesis 1:1).”
Gann described the inner workings of his system as a “Law of Vibration” (see below), and many techniques and correlations that he discovered are included in the Genesis Principles. They are based on geometric and numerical structures which govern the creation and movement of visible phenomenon the case price structures. Just as the DNA molecule contains the blueprint for cellular development in an organism, so we regard the Genesis Principles as the DNA code of market price movements. These principles reliably prescribe the patterns of price fluctuations. Using the Genesis principles we have forecast the major trend changes in the Dow Jones Averages during 1988 with 90 percent accuracy! In this article we will discuss how this was done through Vibration Inversion Points, that portion of the Genesis Principles that deals with trend changes.
Gann liked to describe the basis of his forecasting system as a “Law of Vibration” that he had discovered at work in the financial markets. As he says, “After exhaustive researches and investigations of the known sciences, I discovered that the Law of Vibration enabled me to accurately determine the exact points to which stocks or commodities should rise and fall within a given time.” We have coined the term, “Vibration Inversion Points” (VIP) as another name for Faraday’s “mathematical points of force” which trigger trend changes. Vibration Inversion Points are places at which energy vector forces intersect. These points in a price chart are often critical loci for summary energy vectors that can reverse trends in the markets.
Our discovery of Vibration Inversion Points came after we asked ourselves the question, “Could the different price patterns of financial markets be unique mathematical fingerprints based upon an intrinsic geometric structure’?” It is possible that geometric forms, reflected from planetary positions, could provide the keys to price movement in the various markets. It is well known that many crystalline structures are patterned on geometric forms. A crystal of salt, sugar or water each have unique geometrical and mathematical structures.
We believe that each geometric form has corresponding mathematical values. Just as certain substances will only crystallize in the form of a particular geometric matrix, so numbers and geometric forms which govern a segment of a price chart are in an isologous family relationship. Geometric forms have morphological number equivalents that have been found to correspond to price targets and trend change dates. When a certain number or form is vibrationally active, the resulting chart pattern produced by the markets will display these number constants with high repetition. Our next article will describe how the number 13 was vibrationally active during the crash of October, 1987 and why this number is so important to the U.S. stock market. In the remainder of this article, we shall discuss the Vibration Inversion Point that is built from a geometrical form with 60 degree angles. We call this the Solomon Vibration Point.
Advanced Books and Courses on W.D. Gann Methods
The most symmetrical geometric form that contains 60 degree angles is the equilateral triangle. This was discovered (or rediscovered) by Pythagoras, who expressed it as a geomathematical figure called the tetraktys. As a central symbol of the Pythagorean philosophy, the tetraktys demonstrated that all phenomena can be explained by numbers and geometric forms. There are many examples in nature of the 60 degree structure, such as the 60 degree angle formed by water molecules when they crystallize (freeze). Based on our market research, when the planets form multiple 60-degree angles, a type of geometric crystallization occurs causing a restructuring of the vibrational energy at work in a particular market. The crystallization effect usually occurs at turning points in the markets, Faraday’s “mathematical points of force (Vibration Inversion Points).”
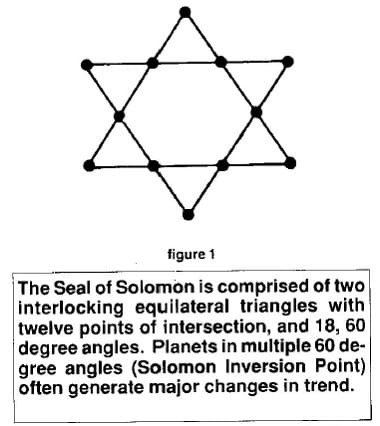
When you take two equilateral triangles pointed in opposite directions and superimpose one upon the other, you will have constructed the Seal of Solomon, or Star of David, an extremely important geometric symbol in the history of ideas as well as market timing. Its two equilateral triangles intersect each other with perfect symmetry (see Fig. I). Solomon’s Seal has been given a number of interrelated psychological, mythological and cosmological interpretations. One of its primary meanings is to symbolize the intersection of the infinite with the finite: “As above (in the realm of eternal forms), so below (in the world of time and price).” Of all the personages in the Bible, it was Solomon who combined the qualities of wisdom and wealth. He was famous for his practical wisdom in ruling his kingdom, and the legend of his vast stores of gold is part of scripture: “Now the weight of gold that came to Solomon in one year was 666 talents of gold (2 Chronicles 9:13).”
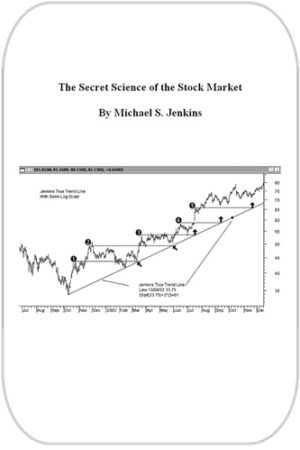
Having provided some theoretical groundwork, let us give some examples of how the Solomon Vibration Point has worked in the stock market. On December 4, 1987, the Dow dropped down to test the lows that were established during the October crash. This was 34 trading days (a Fibonacci number) from the October crash low (see chart). However, the real reason why December fourth was a test of the major low and a major trend change had to do with Vibration Inversion Points. If you look up the positions of the planets in an ephemeris, Venus, Mars and Neptune were all aspected exactly 60 degrees from each other, forming the Solomon Vibration Point. They also were all in the sixth degree of signs (the Solomon 666). Traditional financial astrology states that planets forming the 60 degree angles (sextile) to each other have a positive influence on prices. This should have caused a rally until the aspects were exact. In this case this interpretation was obviously wrong.
What is important in the formation of the Solomon Vibration Point is the number of 60 degree angles. It is not simply another name for a sextile aspect. A single aspect between any two planets is nowhere near as important as the aggregate of the same aspect in the totality of planetary positions. This multiple identical aspectation creates a harmonic augmentation of the energy field. The nature of the effects which a Solomon Vibration Point will have on a market depend on the sensitive degrees of that market. When planets forming Vibration Inversion Points aspect those sensitive degrees their effect is more intensified.
In another example, the record-breaking drop of September 11, 1986 took lace when the angles between Mars/Jupiter and Venus/Neptune were exactly 60 degrees. We took advantage of this opportunity by establishing an option position which gave us 534 percent profit in one day! A similar pattern occurred on the January 8, 1986 record-breaking drop. Finally, look up the 60 degree aspects of the planets which formed the Solomon Inversion Point at the bear market low of August 9,1982! These major turning points confirm the importance of the Solomon Vibration Point. Those who traded the market based on the traditional astrological interpretation of the “harmonious” sextile aspects experienced great difficulty.