Trading Articles
Bear Market Survival Kit By Anthony Trongone
Any system can produce stellar results when it suggests taking a position in the same direction of a trending market. But what do you do when the market quickly changes direction? Few if any trading systems work across all economic environments. As you know, any system can produce superlative results when it suggests taking a position in the same direction of a trending market. However, the performance of these same systems is rendered ineffective as soon as the market changes direction. This article shows how you can capture profits when taking a long position in a downtrending market. Going back to the 340 days of the previous bear market, I ran the numbers to see if a late upside rally contributed to additional buying or if it reinforced more selling when we are in such a nasty trading environment.
GOING AGAINST THE GRAIN
When we are in the grips of a bear market, should we try to magnify profits by joining a late price run once it is in motion? Viewed another way, when the market is experiencing a strong rally from 3:00 to 3:30 pm, should we take a long position at 3:30 and hold this position until the ringing of the closing bell (4:00 pm)? Why would anyone take a position in such a perilous environment? Besides the precipitous downturn, volatility is at its highest, which makes this a dark and dangerous setting. Despite the turbulence, an aggressive investor who knows how an instrument trades in these remaining minutes can profit in this fertile trading environment.
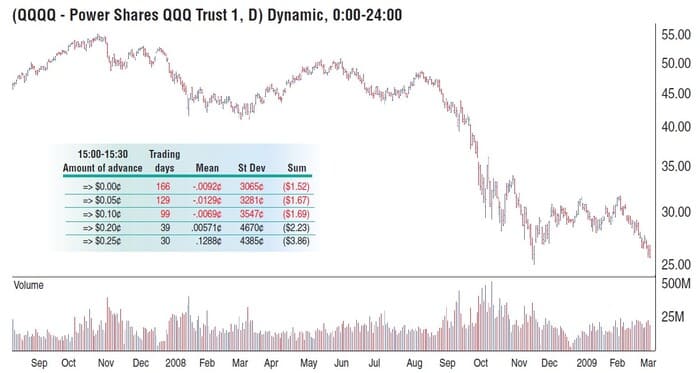
I begin this analysis on October 31, 2007, when the QQQQs stood at $55.02 — its last close over this price. The next day, this exchange traded fund (ETF) began a relentless slide toward the $25 mark. The analysis ended on March 9, 2009, with a closing price of $25.70 — its lowest close, before the liftoff phase into a new bull market. The statistics do not include preholiday trading days (that is, 3:30–4:00 ET trading volume below five million shares).
TRADING BACKGROUND
With an average trading volume of 34 million shares in the final hour of trading, the PowerShares QQQQ is a good representation of investor psychology. The Qs represent the intraday movements of 100 companies; however, it trades as a single security, allowing investors to participate in the collective performance of a portfolio of companies. With active pre- and aftermarket trading volume, the Qs are an attractive trading choice, since it normally has just a penny difference between the bid/ask price. Another advantage is in its almost- perfect correlation with the emini NASDAQ 100 futures contract.
These two instruments, with 62.5% of its sector weighting in information technology, have no exposure in the energy, fi nance, or utility sectors; therefore, they offer you a powerful combination. Each offers the investor a variety of hedging strategies, such as defending your portfolio against downside risk prior to the release of a “market moving” economic indicator. Most recently, the dollar value of one futures NQ contract was worth 814 shares of this popular ETF.
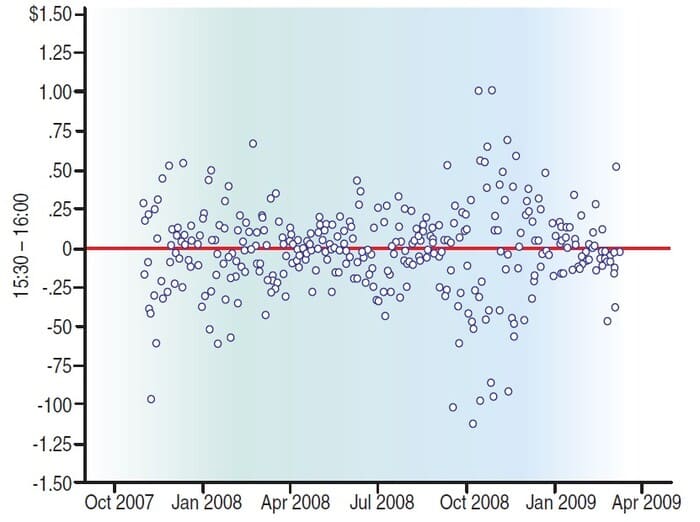
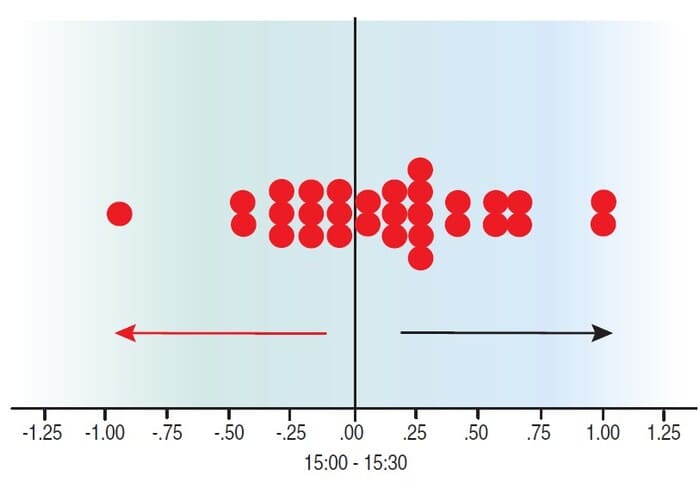
Before we delve deeper into the results of this system, let’s look at trading in this late hour. Despite experiencing a 340-day drop of $29.21 (a 53% decline), the index was positive in the fi rst half of this hour, as it was able to register a $3.55 profi t. In the 30 minutes leading us to the closing bell, the loss was $5.40. In this late hour, trading volume was brisk, with trading activity averaging 20 million shares. The scatter chart in Figure 1 shows the results of trading in the fi nal 30 minutes of the regular session. There were 27 days with a performance of $0.50 above or below the 3:30 ET opening price. It is instructive to observe the changes in volatility. After encountering the price swings in the autumn of 2009, they became less common. In fact, the tight clustering of these scores (the right side of the scatter chart) may have been instrumental in producing the long bullish run.
Suggested Books and Courses About Chart Patterns
In the chart showing the bear market in Figure 2, the Qs kept above a supportive price of $40 until the autumn of 2008. When it broke below this price, it quickly got ugly. The pale blue insert demonstrates how an advancing 3:00–3:30 session affects prices in the fi nal 30 minutes of trading. Observe how the amount of a price advance (that is, greater than zero; $0.05; $0.10; $0.20, and $0.25) increases the mean performance score of the 3:30–4:00 session. Apparently, as the rally grew in force, the confi dence of active traders grew in strength. For instance, after a 20-cent advance in the earlier session, the 39 trading days resulted in a $2.23 profit, whereas an increase of $0.25 or more brought in $3.86.
RUNNING WITH THE RALLY
Figure 3 shows the results after $0.25 change in the 3:00–3:30 session. The positive side (right side) contains more scores, which refl ects investor sentiment. When the market displayed a late advance, active investors became avaricious. Once there is a 25-cent price change (3:00–3:30), in this environment, investors will behave more aggressively. In these 30 days, the standard deviation was $0.44; therefore, we could expect 16% of the trading days to score above $0.57. Pacing this fever pitch are active market participants scrambling to take positions before the close. Apparently, a late rally often inspires a herding mentality. This, in turn, puts trading volume at its highest (36 million shares) because it intensifi es the greed factor as prices forge ahead and rally to the upside, producing six of the 30 days that rallied $0.50.
PUT IN STORAGE UNTIL THE BEAR RESURFACES
No system is effective across all economic environments. This strategy is particularly meaningful for contrarian investors and for anyone who has difficulty sitting on the sidelines during a 340-trading day blowout. Remember to look for clusters of extreme price swings. When they occur, it is a fertile trading environment, but be cautious. Look for a slowdown in volatility, for it often sets the stage for a long-term recovery. By the time you read this article, this system, which works best during an unrelentless correction, is not likely to be in play. As we know too well, the market can turn on a dime, and the bear can come out of hibernation at any time. Until this happens, you can safely fi le this system away on your hard drive, knowing you have some ammunition ready when you need it the most.
Anthony Trongone has taught overseas e-MBA investment analysis courses to more than 1,200 Chinese graduate students. He is the author of Quantitative Methods for Finance and Investing . As one of 25 “Master Educators” for eSignal, he regularly writes articles on investment strategies.