Trading Articles
Data-Driven Trading Systems: An Analytical Review of Steve Palmquist’s Approach
There are three keys to long-term trading success: knowing what to trade, knowing when to trade, and the ability to vary trading style with market conditions. Here’s how you can select the most appropriate tools for trading the markets. While speaking at a recent trading conference, I asked the audience two questions. The first was, “How many of you think the market will be up or down by the end of the year?” About half the attendees thought the market would be up by the end of the year, and about a quarter thought the market would be down. The second question was, “How many of you do not care whether the market is up or down by the end of the year?” In the entire room only about three people raised their hands. I knew these were likely to be the successful traders in the room.
ADAPTING TO THE MARKET
Successful traders have a toolbox of well-tested techniques for use in bullish, bearish, and trading range markets. Based on previous testing and analysis of each of their tools, they know which ones to be using in the current market environment. Whether the market is going up or down does not matter to them; they have learned to adapt to the market because they understand the market will not adapt to them. This is why successful traders have different tools for different market conditions and switch among them based on what the market is doing. If the market direction is important, it is usually a signal that the trader is using the “hold & hope” approach rather than adapting to the market.
Hope is not a trading strategy. Failing to adapt to the market as it alternates between bullish and bearish modes will give traders practice at exercising stops.
KEYS TO SUCCESS
Knowing what to trade comes from testing and research. Testing allows you to get to know a trading system; you understand how it will react in most situations. Knowing when to trade comes from analyzing the current market environment and selecting the most appropriate tools for the current environment. The right tools for the current environment are determined by testing and analyzing those tools in each of the three major market modes.
The ability to vary trading style with market conditions comes from having a trading toolbox with specific tools for each of the three major market conditions and an understanding that the risk levels vary by market condition. You can compensate for different risk levels by varying the number of trading positions and position sizes. Using the same trading tool in all market conditions will likely give you practice at exercising stops while the account moves in yo-yo mode — up and down, up and down.
Trading system ideas generally begin with an observation, but observation alone is not enough. You need to test and evaluate the observation to find out whether it is suitable for trading. Trading off of tips, recommendations, the talking heads on TV, and techniques that are not data-driven will often have mixed results. One common observation about stock movements is that they usually do not go straight up or down; they tend to move in cycles or waves. Stocks moving up often pull back or retrace part of the upward movement, then may resume the trend after a pause. Since stocks tend to move in waves, one trading strategy may be to enter a position at the end of a pullback, then exit when the stock approaches resistance. Many example charts can be shown illustrating this behavior, but only a few examples prove nothing. The key questions are how often this happens, what to look for to find these patterns, and when to enter and exit the setups.
DEFINE YOUR STRATEGY
The first requirement for testing a trading system is a clear definition. It’s amazing how many people will describe their system in general terms then wonder why they get mixed results. Many candlestick systems are described using terms like “larger than,” “long tail,” and “short upper shadow.” Since different people will have different ideas on what “large,” “long,” and “short” mean, they may get different results. In fact, they are trading different systems. Essentially, trading a technique without clearly defining it is trading on hunches. Trading a technique without testing and analyzing it is trading on hope. And hope, while an important part of life, is not a trading strategy.
PULLBACKS
There are many different types of pullback trading strategies; they are the bread-and-butter tools in many traders’ toolboxes. One of the more interesting ones looks for a setup consisting of a series of three consecutive lower highs along with three consecutive days of lower volume. The setup identifies stocks that may be interesting. In addition to the setup pattern, the declining volume pullback pattern requires a trigger condition in order to initiate an entry. In this case, the basic trigger condition is to look for a higher high, which indicates that the series of lower highs has ended, and the pullback may be over.
The declining volume pullback pattern is illustrated by the price and volume patterns for Freeport-McMoran Copper and Gold (FCX) shown in Figure 1. After moving up during the last week of March and the first half of April 2011, FCX pulled back for three days on lighter volume each day (down arrows). After making lower highs for three days, FCX satisfied the trigger condition by making a higher high on April 15 (marked by the up arrow). Following the pullback and trigger condition, FCX moved up 9% in just five days.
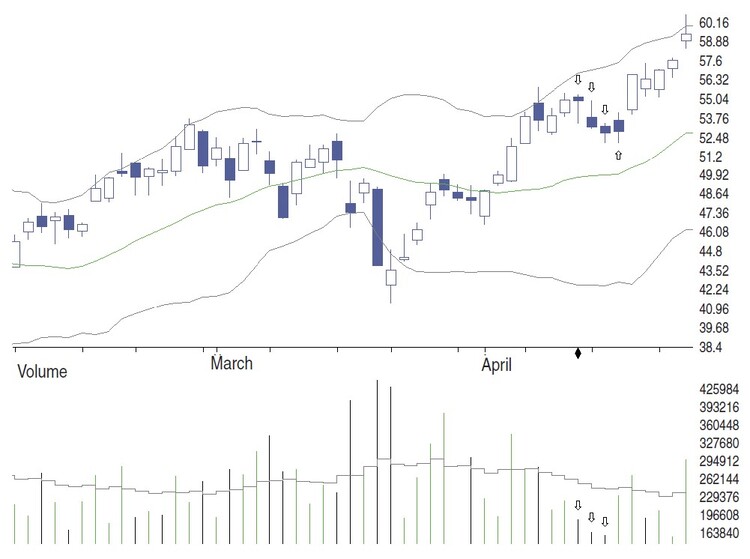
This is one example. You need to understand how often this declining volume pullback pattern occurs and how often the resulting trades are profitable. After analyzing the results of a large number of trades, you can develop an understanding of whether the declining volume pullback pattern is a trading tool worth considering. In addition to the series of lower highs occurring on consecutive days of lower volume, there are two other conditions that are used to filter out stocks that may have wide spreads or be difficult to enter or exit quickly. These requirements are requiring the close to be greater than $5, and the 21-day simple moving average of the volume must be greater than 200,000.
Using this declining volume pull back technique is fairly simple. When a scan identifies the setup condition as having occurred yesterday and a trigger condition occurs today, a position is entered at the opening price tomorrow. After entering a position, it is held for three days and then sold at the next open. There is no need to be glued to the monitor all day. The system is traded entirely on end-of-day data, which makes it easy to use. The results of most trading techniques are affected by market conditions. For this reason, on the initial test of an idea, I want to pick a market period where it should work. If the technique does not work in favorable conditions, I can save myself a lot of time and effort and move on to testing another idea. If it does work in favorable conditions, I will invest the effort to do a much more extensive testing process in order determine whether the trading tool is something I want to use.
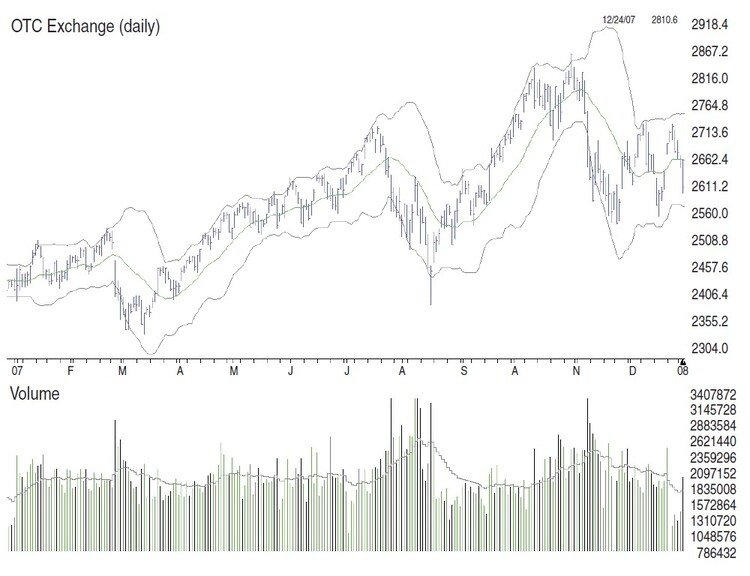
In this case I ran the initial test of the declining pullback scan during 2007, which was moderately bullish with several up-and-down legs as shown in Figure 2. If the declining pullback technique did not work during this type of market environment, I would stop looking at it and move onto something else. I tested the declining volume pullback system using Aiq Systems Trading Expert Pro on my trading database of about 2,500 stocks, which is generally made up of stocks trading above an average of 200,000 shares a day. Lower volume stocks can have wide bid/ask spreads and may be difficult to get into or out of when the market is moving quickly.
As shown in Figure 3, the system showed over 2,100 trades during 2007, and 54% of them were winners. The average winner gained more than the average loser lost and the annualized return on investment (ROI) beat buy & hold, indicating that the system was worth investigating further. It should be understood that backtesting does not guarantee results or predict the future; in fact, nothing does. However, backtesting gives you an idea of how something usually performs, and I would rather trade a system with this understanding than one for which I have no idea what to expect.
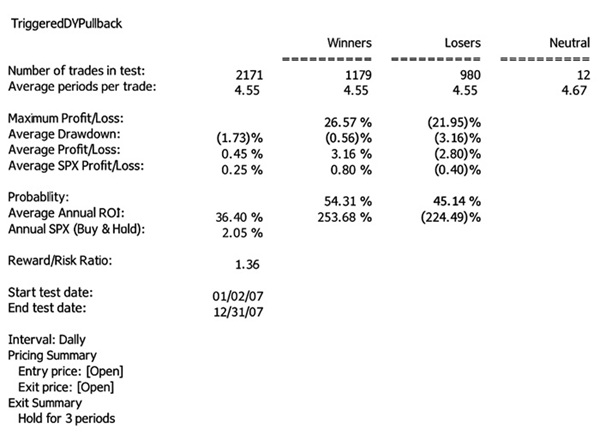
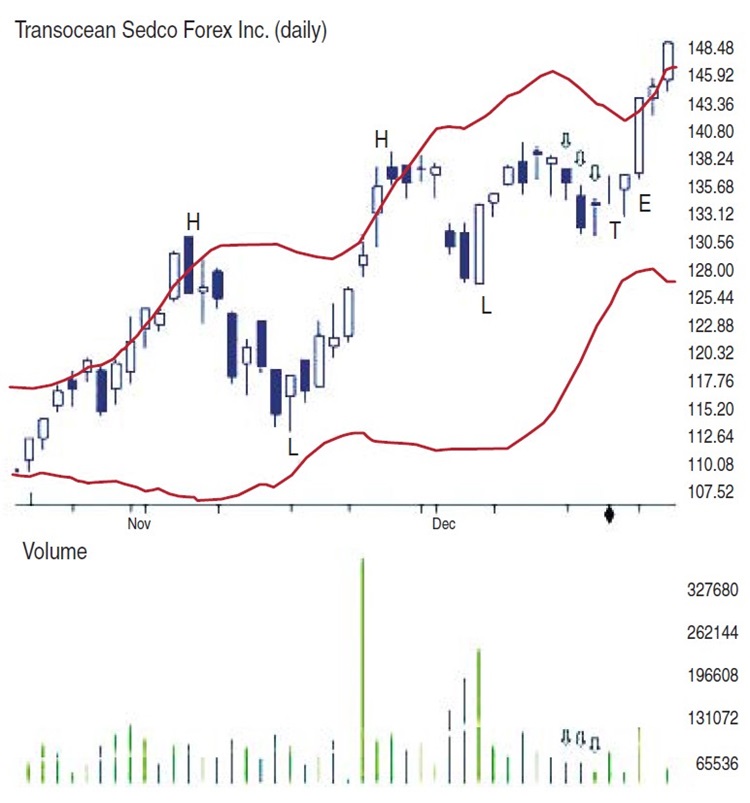
The test data shown in Figure 3 looks at every stock during 2007 that met the requirements of three consecutive days of lower highs and lower volume. It did not consider whether stocks were in uptrends or downtrends. Stock in uptrends form a series of higher highs and higher lows. Figure 4 shows another example of the declining volume pullback pattern occurring in an uptrending stock. The higher highs are marked by “H” and the higher lows are marked by “L.” The declining volume pullback is marked by the down arrows, and the trigger condition of a higher high is marked by a “T.”
In order to develop an uptrend filter for the declining pullback system, I defined an uptrend to exist if the highest high of the last two weeks is higher than the highest high of the previous two weeks, and the lowest low of the last two weeks is higher than the lowest low of the previous two weeks. Adding this uptrend filter to the definition of the declining pullbacks scan and running the test during 2007 with the additional filter increased the percentage of winning trades from 54% to 57% and the annualized ROI from 36% to 46%. Based on this data, I added the uptrend filter as a standard part of the declining pullback scan.
MANAGING YOUR EXITS
Too many stock traders focus on the entry of a position and do not pay as much attention to how the exit strategy can affect results. Based on the testing and analysis of how stocks behave around the Bollinger Bands, presented in my book How To Take Money From The Markets, I have incorporated profit-taking near the upper Bollinger Band into several of my swing trading systems for long positions. One of the ways I use this research is by realizing that since the upper Bollinger Band often acts as resistance, I can prioritize available setups by how much room to run they have before hitting resistance, or the upper Bollinger Band.
Based on the research from the book, I decided to add a filter to the declining volume pullback scan so the trades were only taken when the trigger point was at least twice the daily range below the upper band. The logic here is that if the band acts as resistance, a pullback pattern forming very close to the bands does not have far to go before it hits resistance. A pullback pattern forming well below the upper Bollinger Band has more opportunity before it bumps into the upper band. Adding this filter, along with the uptrend filter, to the declining pullbacks can significantly improve results, as shown in Figure 5.
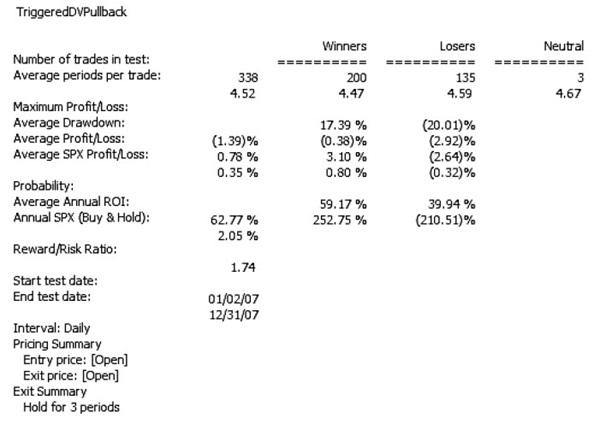
The percentage of winning trades increased from 57% to 59% and annualized ROI increased from 46% to 62%. Using the research results from the Bollinger Band testing provided an opportunity to improve the performance results of the declining volume pullback scan. This is another advantage to testing and analyzing trading systems.
The information gleaned in testing one system can be helpful in improving a different tool. While these results are interesting, they have all been for a single test period. You need to see how the market performs in other test periods and market environments in order to determine the effectiveness of the declining volume pullback system.
When most people think of testing a trading system, they focus on calendar periods. They assume that a test run over a five-year period is more important than a test run over a one-year period. The underlying assumption is that the market repeats based on calendar periods — in other words, next year is going to look like last year, or the next five years are going to look like the last five years. A quick glance at a long-term market chart indicates that this is not the case. A previous time period is often not similar to the next time period. Testing in time periods, whether they are one-, two-, or five-year periods, does not tell you much about how the system may perform going forward.
Advanced Books and Courses on Technical Analysis

One interesting thing about the market is that while it may not repeat on a time frame basis, whatever the market does in the future will be a combination of bullish, bearish, and trading range environments. The market can’t do anything else. It’s going to go up, down, or sideways. If that is what the market does, then instead of testing calendar time frames we should focus our testing on different market environments instead of just different calendar time frames. Knowing how a system performs in each of the three major market environments can be more useful than knowing how it performs in any specific time frame.
TESTING IN DIFFERENT MARKET TYPES
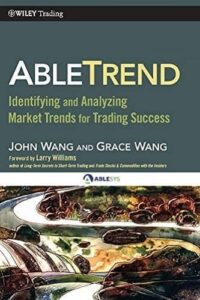
I identified six different bullish market periods and tested the declining pullback scan in each one of them. The results can be seen in Figure 6. The declining volume pullback system was profitable in each of the six bullish market conditions in which it was tested. The percentage of winning trades was above 62% in five of the six bullish markets. The lowest results, 56% winning trades, came during the 2008 market crash. The declining volume pullbacks can show good results during multiple bull markets.
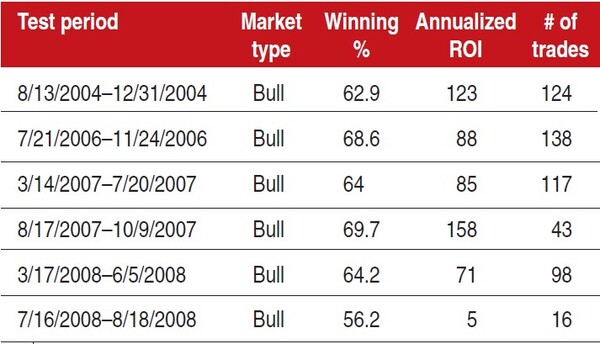
After testing the declining pullbacks scan in the six bullish market periods, I went back to a long-term market chart and identified six bearish market periods. Testing the declining pullback scan in each of the six bearish market periods is summarized in Figure 7. The declining pullback scan shows losses in four of the six bearish markets in which it was tested. If the declining pullback scan loses money two-thirds of the time when the market is experiencing bearish conditions, then instead of using the scan I would want to use one of the other techniques in my trader’s toolbox when the market is declining.
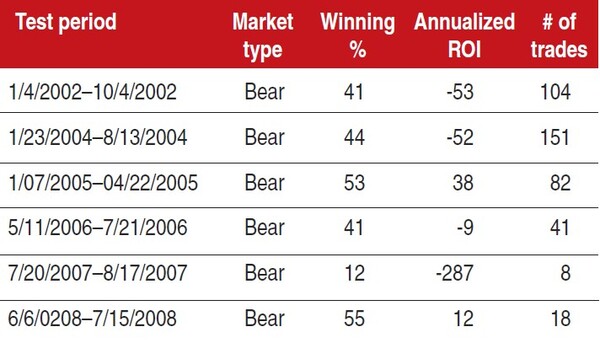
Figure 8 shows how the declining pullback scan performed in several different trading range market environments. While the percentage of winning trades and the annualized ROI were lower than bullish market environments, the scan showed profits in each trading range period. Based on the test data, I would focus on using this scan during bullish market periods and avoid using it during bearish market periods. The scan can be interesting during trading range market environments when combined with additional volume patterns.
BE PREPARED
Successful traders have trading tools that have been tested in different market conditions. They look at the current market and select the most appropriate trading tools based on their understanding of how each tool performs in the three basic market conditions. Traders can determine which of the three modes the market is currently in by looking at a daily chart of the market action over the last year, using the five- and 20-pe-riod moving average filter, or through trendline analysis.
Understanding how to read the current market conditions is very important. If traders have not tested their tools in different market conditions or do not adapt to changing market conditions, they are taking unknown risks. There are no guarantees in trading, but backtesting helps remove some of the emotion, hunches, and unknowns. It can show you how a particular system has performed in different market conditions in the past and what types of filters may be most interesting in prioritizing trading opportunities. The knowledge of what to expect from a trading tool and seeing how different tools perform in different markets allows traders to adapt to the market rather than just guessing.
- Steve Palmquist is the founder of www.daisydogger.com, publisher of the Timely Trades Letter, author of Money-Making Candlestick Patterns and How To Take Money From The Markets, and is a contributor to ETF Trading Strategies Revealed.