Trading Articles
Day Trading Cup Breakouts: Intraday Entry and Risk Management
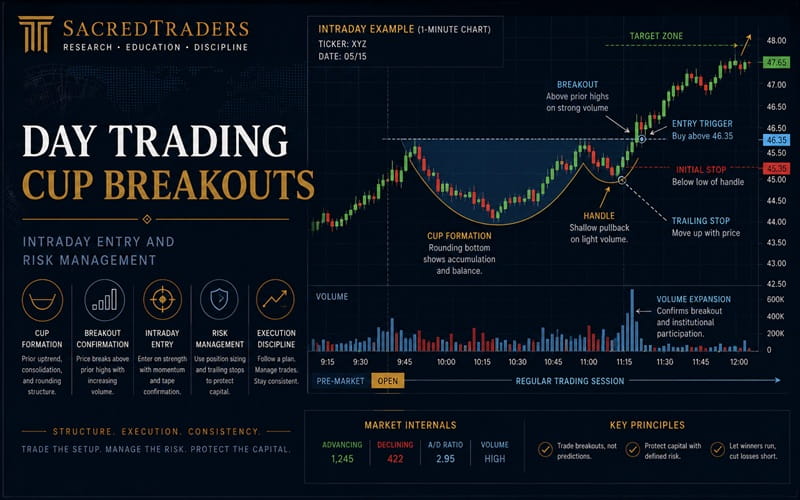
Here’s how you can daytrade momentum trades. Entering and exiting intraday trades using precision technical trading signals has been popular with both retail and institutional traders, since it limits overnight risk exposure. The primary elements of professional daytrading include scanning for volatile breakouts during the first hour of the trading day, setting specific technical entry signals to initiate new trades, and using careful risk management to scale in and out of positions once they’re initiated. Daytrading stocks, e-minis, forex, and exchange traded funds (Etfs) all require different entry and exit signals.
THE TWO-DAY HIGH STOCK CUP ENTRY
The strongest entry pattern in daytrading equities is relatively simple. Entries are set using new high price breakouts roughly at 0.35 or so above the prior day’s highs during the first hour of the market open, following a cup breakout above a 35-step (as in, 35-period) moving average (MA) crossover on a two-day, one-minute chart on high volume.
In this intraday breakout in Molycorp Inc. (MCP) in Figure 1, you can see that a bullish cup was formed between 44.7 and 45.3 during the premarket, slightly above the prior day’s high. A long entry signal is generated at 0.35 above the cup high at 45.65, with the exit generated when the price action crossed back under the 35-step MA at 47.8.
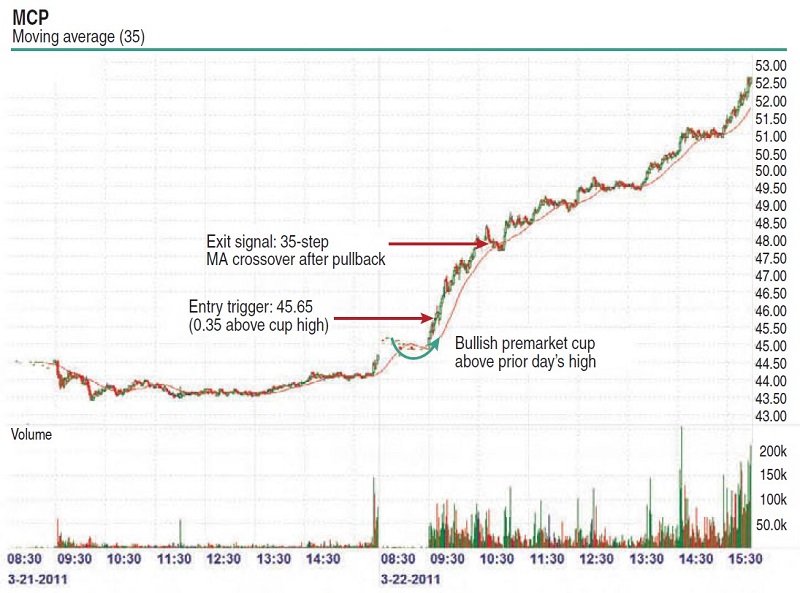
The chart setup is a one-minute, two-day chart with the time set to display data from 7 am to 4 pm Eastern time. The reason for showing so much premarket data is to be able to see gaps, cup patterns, and trends (with volume) before the start of the trading session. Focusing on premarket price action helps successful daytraders develop a specific price-based entry strategy for trading once the market opens. It is usually not a good idea to enter new positions premarket because of wide spreads and lower liquidity.
Daytrading round-trip durations should be anywhere from several minutes to 45 minutes per trade, with the majority of stock daytrades from two to 15 minutes in length (since the market often pivots in 10- to 20-minute segments during the opening hour). Many new daytraders hold their positions too long instead of scaling in and back out with speed and precision. Stop-losses for stock daytrades are no more than 0.4 of a point, with exit targets of 0.7 to 1.5 points.
AVOIDING FALSE STOCK BREAKOUTS
Getting into a daytrade only to see it quickly reverse against the trade is a common problem that intraday traders face. Filtering to help avoid false breakouts involves several components:
- Setting price “safety buffers” outside of obvious support/resistance levels, and
- Using market internals to help decide which sectors and which directional bias (long or short) to trade in.
Price-related safety buffers, as explained in the Mcp example in Figure 1, include using 0.35 above the prior day’s cup patterns for entries. Using market internals requires traders to look at several additional signals to put the markets in context before taking on a daytrade. Market internals and the two-day pattern of the broad market indexes (such as the S&P or NASDAQ Composite) are also often used to determine how much size to trade. If, for example, the S&P is range-bound inside the prior day’s high-low range, then a lighter share size should be traded. Similarly, checking the Arms index (also known as TRIN) is important; if TRIN is less than 0.7, then more size is traded for long-bias entries, and if TRIN is over 1.5, then more size is traded for short entries.
Similarly, when you are scanning for which stocks to trade, it is best to check the sector percent changes to see which sectors are strongest during a given market day. In the chart of Alcoa Aluminum (AA) in Figure 2, you can see a false breakout entry was avoided since the NASDAQ Composite and Arms index signals were showing a short bias, despite a breakout attempt. Had you just purchased the stock because it was taking out new highs, you would have taken a stop-loss, since it pivoted back into its trading range shortly after the initial breakout attempt.
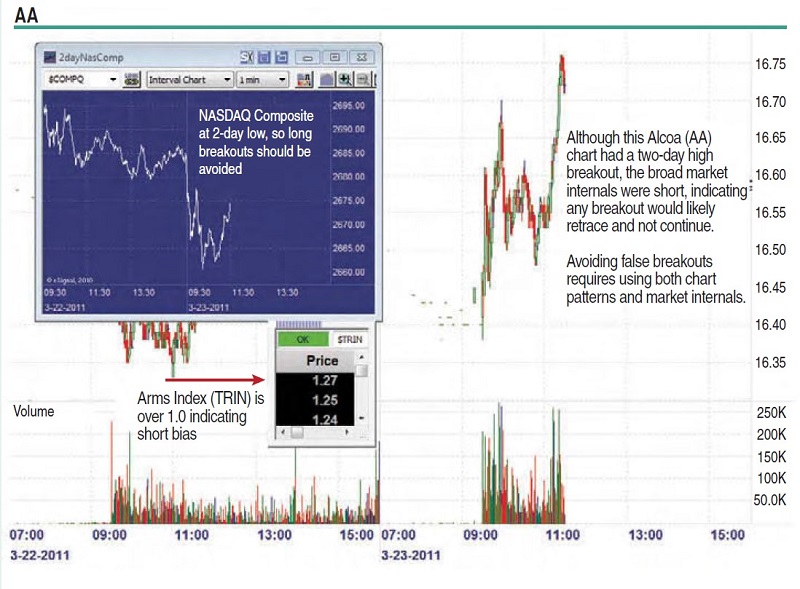
Combining the market internals with specific daytrading chart breakout patterns is an overlooked, yet essential component. Simplistic software scanners often cause false breakouts and stops because they only look at individual technical signals (moving average crossovers, new highs, and other patterns) without taking the more important broad-market internals into account when generating signals. Astute traders know that it takes a thoughtful combination of technical signals with individual chart pattern signals to generate actual trading entry and exit criteria.
NAVIGATING THE EMINI
Daytrading the emini (ES) can be challenging due to the frequent pullbacks and choppy nature of this particular instrument (especially after 10:30 am ET). Fortunately, cup pattern breakouts during the opening hour of the market can provide solid trading opportunities when careful technical signals are used to help traders determine when to enter new positions. For example, in the emini S&P 500 chart in Figure 3, an entry set three ticks above the cup high generated a winning buy signal. The best chart to use when daytrading the e-mini ES is simply a one-minute candle chart, which reveals upcoming day-trading breakouts one candle at a time during live markets. Buy signals are generated when two criteria are met:
- The opening breakout is above a prior one-minute candle high following a bullish cup upside breakout
- This “micro” cup also follows a “major” cup that formed during the 8:30 am to 9:30 am ET premarket session (Figure 3).
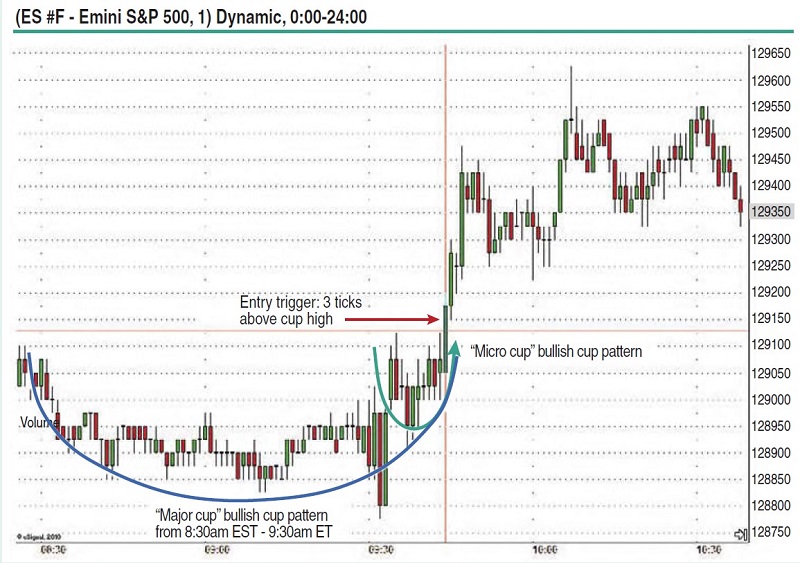
Bullish cups look like the letter “U” and are best seen using one-minute premarket ES charts for e-mini traders. Daytrades for the e-mini ES are best done using a faster scalping method, in which round trips last anywhere from one minute to seven minutes. Exit signals for long positions include one-minute shooting star candle charts, one-minute hammers for shorts, and/or price retracement of no more than three ticks against the initial position. Stop-losses for e-mini ES daytrades are three ticks, with exit targets of five to 12 ticks.
Advanced Books and Courses on Day Trading & Scalping


FOREX FIVE-MINUTE CUP BREAKOUTS
The two strongest forex daytrading long-bias signals are generated with five-minute hammers and bullish cup breakouts. For example, in the chart of the US dollar/Swiss franc (Usd/Chf) in Figure 4, you can see the first long entry signal is set 40 pips above the hammer high and the second entry at 40 pips above the major bullish cup high. Using a false breakout filter of 40 pips like this for intraday trades can help currency traders stay clear of choppy entries and get in on stronger continuation breakouts.
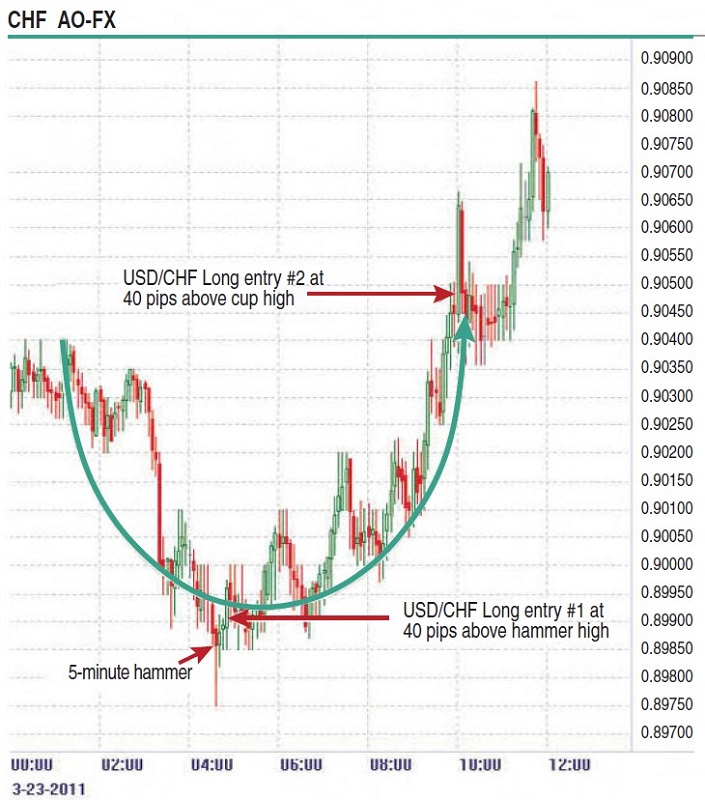
While a five-minute candle chart gives the strongest signals, forex traders who trade larger sizes should also use a one-minute candle chart as well to keep an eye out for countertrade pivots. Initial stops for currency trades are set at 40 pips for intraday trades, with exit targets of 70 to 150 pips for daytrades. In addition, daytrading cup breakouts in currency pairs is best done when the seven-day chart is at a new high for confirmation (days following those that the average directional movement index [ADX] is over 30), providing for more volatile, strong-trending daytrade breakouts.
ADVANCED DAYTRADING WITH ETF HEDGES
One popular daytrading strategy involving exchange traded funds (Etfs) simply calls for initiating simultaneous long positions in Etfs that move opposite one another during the opening 20 to 30 minutes of each day’s open. Then the trader scales out of the one that is going against him/her and into the one that is profitable on increasing size. The chart of Direxion Daily Financial Bear 3x (Faz) in Figure 5 shows how it moves up while its opposite Etf, Direxion Daily Financial Bull (Fas), which can be seen in the inset, moves down in the same direction and technical pattern. Using the same entry strategies— that is, 0.35 above a bullish cup above the prior day’s highs—generated a win in the Faz chart. You can initiate a small-share trade in each instrument and add to the winner once it continues.
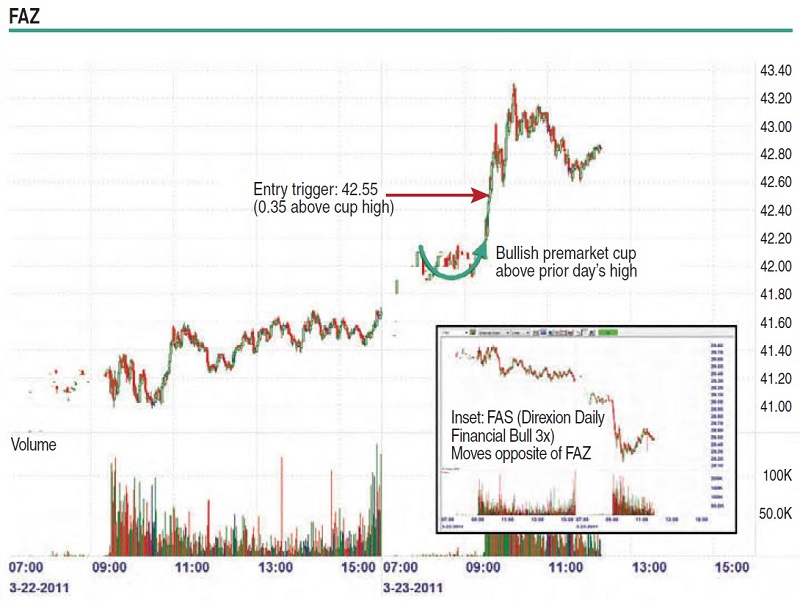
Experienced traders may want to initiate simultaneous long positions during the first three to five minutes of the market open in both Etfs without waiting for a cup pattern confirmation. Those traders may want to scale into the winner by adding to it, then stopping out of the one going against them, so that they are leveraged into the winner and out of the loser. That way, the trader can capture a volatile breakout correctly and be in the trade regardless of market direction, since they have “mirror image” trading patterns.
POSITION SIZING AND TRADE MANAGEMENT
Daytraders are encouraged to use position sizing in addition to technical analysis, which involves starting off all new positions on very small sizes (10 to 50 shares for stocks, a single emini ES contract, a mini-lot in forex) and scaling up by adding to positions only after they are profitable by a predetermined amount. Originally pioneered by trading psychologist Van K. Tharp, the concept of position sizing simply means adding to winning positions and scaling out of losing ones, versus “all or nothing” trades.
So for a typical stock daytrade, a trader may initiate an initial position of 100 shares or less, then double it to a 200-share trade once it is in the money by, say, 0.3 to 0.5, to leverage up. The benefit of this approach is that it allows you to use slightly wider stops and have less risk per trade, since lighter daytrading size makes for smaller capital at risk.
It also has the benefit of instilling more confidence to pull the trigger and get into new positions, since the trader knows less capital is at risk. Once a trade starts to be profitable, the trader can decide to add to it, tighten a trailing stop, or add to the winning position. That way, stops can be kept much smaller since less size is traded during the initial position entries.
TRADING LIKE A PROFESSIONAL DAYTRADER
After trading millions of dollars worth of equities and making thousands of trades, several key insights start to emerge based on technical trading entries and exits in actual trading experience:
- It’s best to trade only on “out” days, in which the broad markets are trading outside of the prior day’s high–low range and to initiate new positions only in continuation cup pattern two-day high or low breakouts during the first hour of the market.
- The use of position sizing helps control for market conditions (up, down, consolidating) by focusing on leveraging into only those trades that are successful, gradually acting based on technical signals (and open unrealized P&L in the trade) as it moves.
- Tape reading when you are daytrading stocks can also make a big difference; tape reading means looking at how fast the transaction price moves through support and resistance levels using either a dedicated tape reading indicator or a Level II box and how fast price momentum takes out new highs. Traders often spend too much time on micro chart pattern indicators and not enough on putting them in context of the broad market before deciding to initiate a new position.
- Being “slow to enter, fast to exit” is key to success as a daytrader. Being more selective about when to enter a trade, then let it move and quickly exit again, often feels early for getting out of a trade, but once the P&L is there, it is time to tighten a trailing stop (often to within 0.02 of market) and exiting quickly to lock in gains.
- Daytrading means putting in a lot of buy-stop orders before the market opens, using cup breakouts, then following up using position sizing and trailing stops once the trades are taken during the market. The professional trader spends more time premarket on proactively scanning and setting automated buy-stop orders, while amateur retail home traders spend too much time in the market reacting to moves.
- Successful daytraders do not spend hours in front of their computers each day following every tick. Most are done by 10:30 am ET each day (with rare exceptions for rally or selloff wide-range market days, which are fewer than one out of 20 trading days on average).
As an intraday trader, putting volatility to work for you means using technical signals and nimble risk-management tactics to generate trading entries and exits over thousands of trades. Daytrading successfully involves a focused approach to combining technical breakout signals with position sizing and market internals to make for a strategic approach to trading.
- Ken Calhoun is a producer of multiple award-winning trading courses and video-based training systems for active traders. He is the founder of DaytradingUniversity.com, a popular online educational site for daytraders.