Trading Articles
Context-Based Trading: Interpreting Patterns Within Market Structure
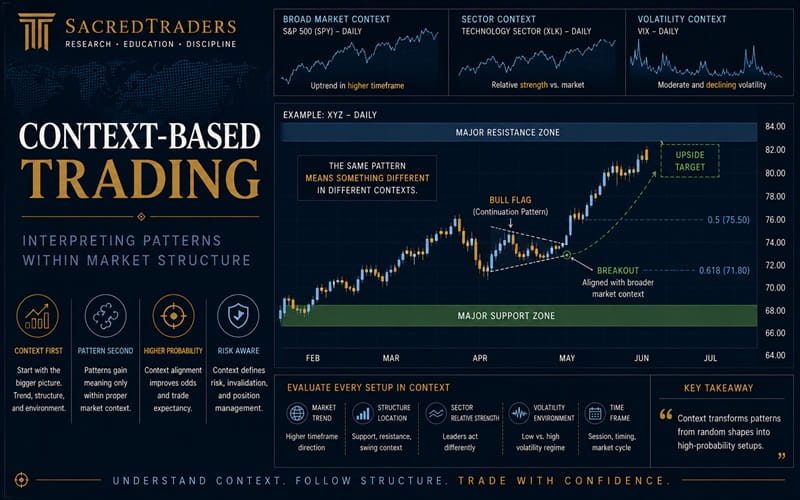
This is how you use stock and index charts to determine market context. You do not have to be a Chartered Market Technician to understand how market context can influence the price behavior of stocks. No stock is an island, and how a stock behaves is often a function of the market at large, which in turn is a function of underlying conditions — the context within which any particular market environment is developing. In the simplest of terms, we know that in a bull market, most stocks go up, and in a bear market, most stocks go down, so this basic idea that market context can provide meaningful clues when studying stock charts is already something we are familiar with when we speak of bull and bear market environments.
IT’S THE CONTEXT
While the use of stock charts can be very complex, often the exercise of comparing the price behavior of a stock to a chart of the market as represented by, for example, a major market index such as the NASDAQ Composite Index or the Standard & Poor’s 500 can help you understand a stock’s potential strength. You are also able to better understand why certain price movements are evident in a stock’s overall price chart. When it comes to understanding the price/volume behavior of stocks, context is everything.
THE PATTERNS DON’T HAVE TO BE PERFECT
In autumn 1998 the stock market was experiencing a very sharp selloff in a very short period of time: a sort of “instant bear market” that lasted not quite three months but saw the Nasdaq fall 33% from peak to trough in that time. In Figure 1 we see the Nasdaq Composite Index daily chart from that period stacked on top of a daily chart of Charles Schwab, Inc. (Schw), one of the early leaders that emerged from the market bottom of October 1998. In this example, the Nasdaq came down in a series of three very sharp waves, the first ending in early August, the second in early September, and the third in early October.
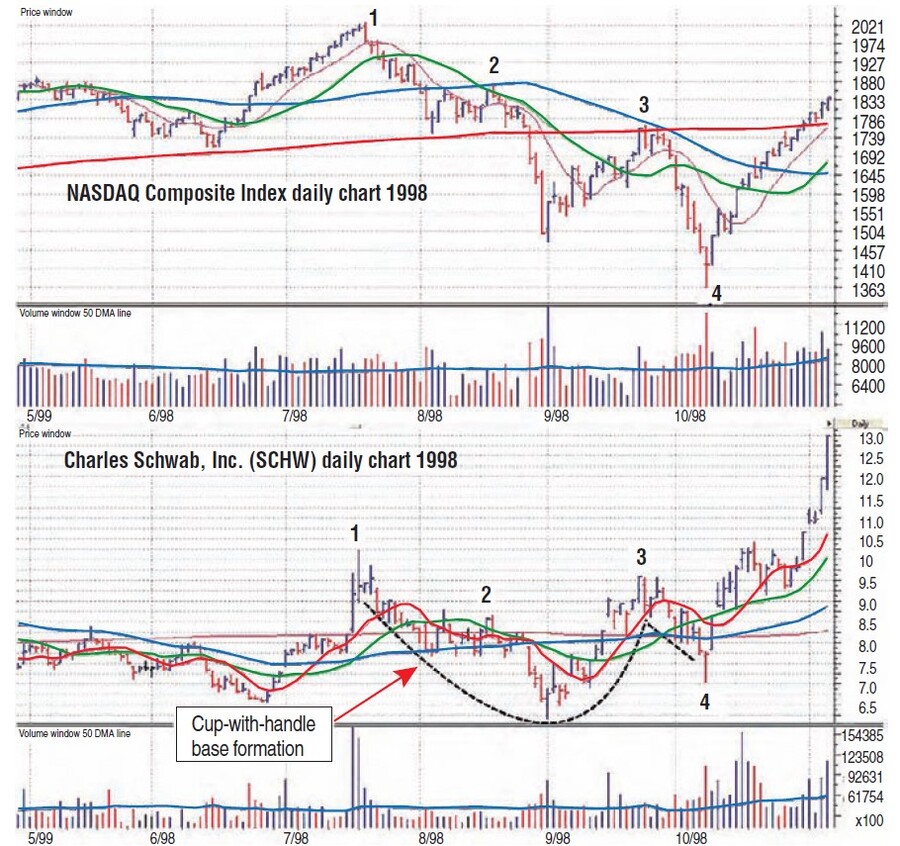
As the NASDAQ was approaching a top in July at point 1 on the chart, SCHW was in fact attempting to emerge from a sideways consolidation on brisk volume — an indication of strength. However, the market began to roll over, putting a lid on SCHW’s attempted breakout. The stock wanted to break out and move higher, but the pressure of a topping market overwhelmed the breakout and SCHW fell back into its base. As the market began an initial leg down from point 1 to point 2, SCHW mimicked the action of the general market by pulling back down in similar fashion.
As the second leg to the downside began at point 2, SCHW also broke sharply to the downside, again mimicking the action of the market on the downside break as well as the reaction rally up to point 3. The market then broke down again to a lower low at point 4, but this time SCHW did not mimic the action of the market as it made a higher low. In fact, the entire pattern became an O’Neil-style cup-with-handle formation where the cup is formed between points 1 and 3 and the jagged handle is formed between points 3 and 4.
In most cases, this steep pullback in the handle would be improper, as a truly constructive handle area will generally hold within a relatively tight price range of 11% or less. However, the extremely volatile and sharp downside break in the NASDAQ Composite Index from point 3 to point 4 explains similar volatility in SCHW’s handle within the overall cup-with-handle formation, and in fact SCHW is displaying powerful countertrending behavior by the time the market bottoms and turns back to the upside at point 4.
This was a critical factor in our decision to purchase SCHW aggressively in October 1998 as the market confirmed a new rally phase. Often, technicians search for perfect chart patterns, but in some cases an imperfect one can be explained by the market environment.
WHERE IS THE MONEY MOVING?
Note that in August 2001, major defense stock Lockheed-Martin (LMT), shown on a weekly chart on the bottom half of Figure 2, was moving higher in a shallow uptrend leading up to the tragic events of September 11, 2001. What did LMT know? At that point, the market, shown on a weekly chart, had been in a serious bear market that began in March 2000, and when the market reopened a week after 9/11 on September 17, it split wide open as it sold off for five straight days.
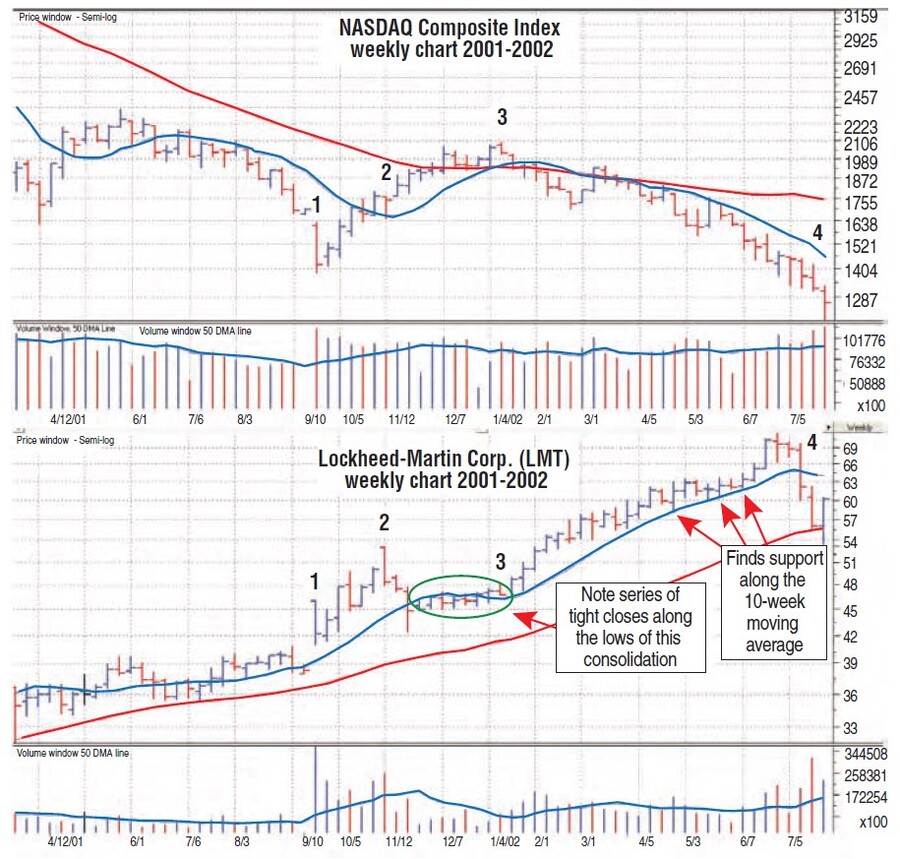
During that week, LMT staged a new-high gap-breakout as we saw in the stacked weekly charts of the NASDAQ Composite index, our proxy for the market, and LMT. After selling off for five days, the market then turned around and began a short rally that carried for 15 weeks from point 1 to point 3.
LMT continued to move higher from point 1 to point 2, then pulled back and began consolidating its prior gains from point 2 to point 3. LMT pulled back during the first three weeks of the consolidation at point 2 before leveling out and drifting upward over the next eight weeks in a series of tight weekly price ranges and closes. At point 3 the market topped out and began a new leg in a continuing bear market, but LMT began to move up off the lows of its consolidation, or base.
The series of tight weekly price ranges and closes along the lows of LMT’s base from point 2 to point 3 is a subtle sign of steady institutional buying. With money coming out of other sectors in the market, institutions were looking to redeploy in tradables that would benefit from the fact that a significant underlying condition was coming into play: that the US was about to move to a war footing. The clue that institutions were moving money in that direction is partly explained by LMT’s tight price action along the lows of the base, but its breakout to new highs as the market began to roll over to the downside was an even starker clue.
LMT continued to move higher for the next several months, finally topping out in June 2002. In this case, market context in the form of changing underlying conditions as the US began preparations for war, combined with logical clues in the weekly chart of LMT, were the pointers telling you where the money was moving.
IDENTIFY POTENTIAL LEADERS
The next two examples show why we view market corrections and even bear markets as constructive market periods, in that nascent leadership will often make itself known amid the more obvious negative tone of a market correction or outright bear market. the 2010 weekly charts of the Nasdaq Composite Index (top) and Rovi Corp. (Rovi) in Figure 3. Rovi was a relatively unknown name as it wended its way higher going into April 2010 as it moved in phase with the market’s uptrend. At point 1, however, things began to change as the market broke off of its peak and began to correct. Rovi acted in lockstep with the market for exactly one week as it too broke off its peak at point 1, but it quickly leveled off as it moved sideways for several weeks.
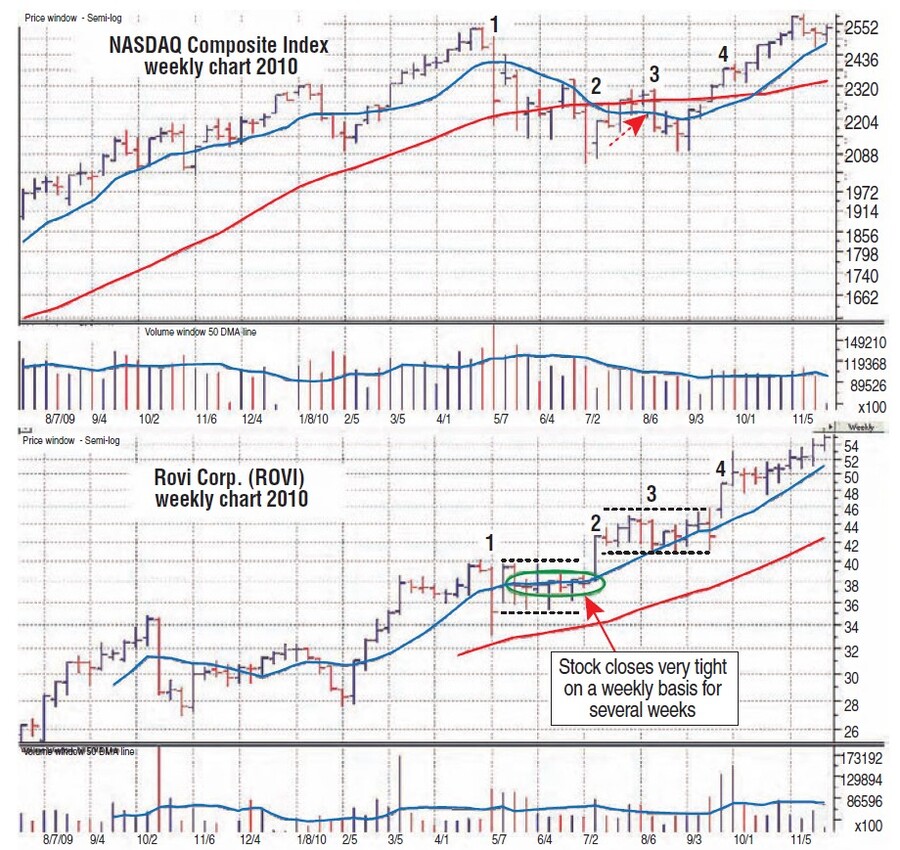
Meanwhile, the market continued lower into point 2, but ROVI broke out of its tight sideways consolidation or base and made a new price high. The market bounced up into point 3 as ROVI continued to move higher after its breakout. At point 3, however, the market pulled back once more, but ROVI held up as it built a second consolidation on top of the first one from which it broke out at point 2. This is an O’Neil-style “base-on-base” formation, and if a stock were to form such a pattern during a strong bull market rally, we might consider that it was lagging.
Advanced Books and Courses on Price Action Trading


However, market context is everything, and when a stock like ROVI builds a base-on-base formation as it moves up slowly while the market is simultaneously going through an intermediate-term correction, then that is showing significant relative strength that identifies the stock as a strong potential leader when the market recovers and begins a new uptrend as it does at point 4.
ROVI then broke out of the second base in the base-on-base formation at point 4 and continued in a sustained uptrend. Throughout the market’s correction, ROVI wanted to move higher, but the action of the market acted as a weight upon the stock, effectively putting a lid on its attempts at new price highs. Instead of correcting with the market, however, ROVI showed its strength by holding each breakout and consolidating the move to new highs each time as it built its formation. In this case, such action in the context of a market correction from April to August 2010 was very bullish for ROVI, and once the weight of the market lifted, the stock was able to continue higher at a more consistent pace.
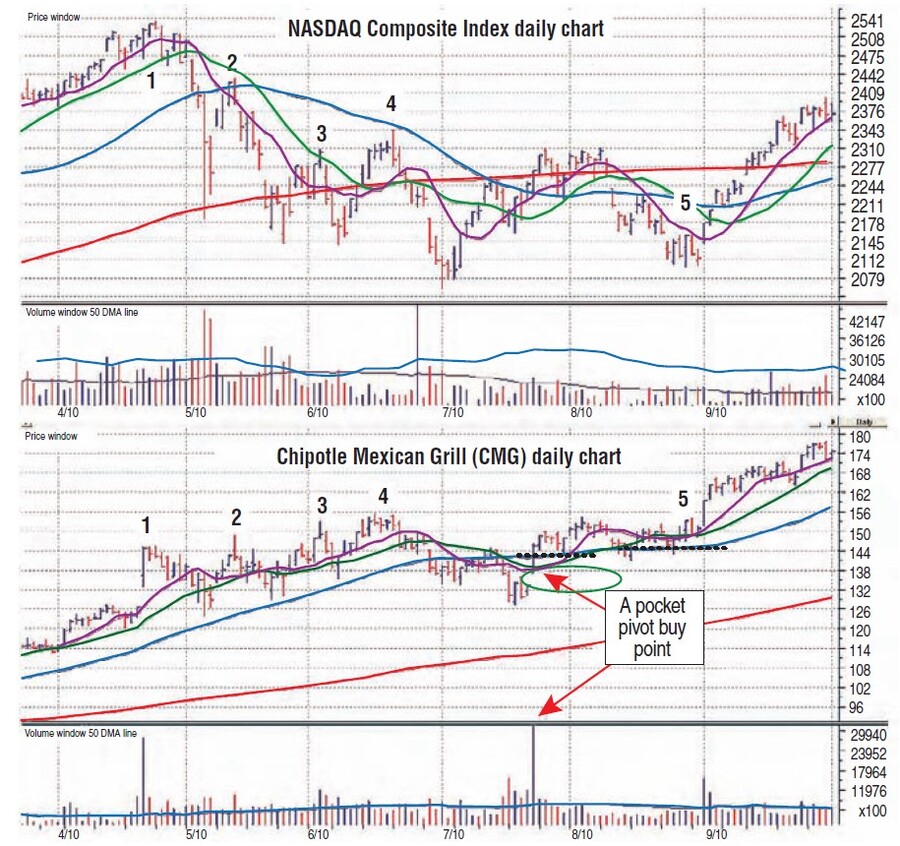
Another example from 2010 can be seen in the chart of Chipotle Mexican Grill (CMG) in Figure 4. It shows some different dynamics during the same market correction from April to August that we examined in conjunction with ROVI in Figure 3. The key juncture occurs right at the end of April as CMG is trending higher with the market and when the market begins a steep downside break that culminated in the flash crash of May 6.
At point 1, Cmg was in fact gapping up and breaking out to new all-time price highs, but the weight of the general market was felt by the stock as it too pulled back, but for the most part held the lows of the gap-up move at point 1. The stock then proceeded through points 2–4 as it made a higher high each time. Each of these moves to a new high coincided with points 2–4 on the Nasdaq chart, which are all peaks of bouncing rallies within a broader downtrend. In fact, at this stage Cmg was telling investors that it really wanted to move higher, but the weight of the market downtrend was keeping a lid on the stock. After point 4 the market broke sharply to new lows, and the tidal pull was more than Cmg could resist, so it too began to move lower.
Eventually, the market bottomed and began to rally, but Cmg rolled over and shook out once more to lower lows before turning back to the upside. A pocket pivot buy point marked the turnaround in Cmg. As we moved into point 5, the market, as indicated by the Nasdaq’s chart, began to roll over again, but Cmg stood its ground, moving roughly sideways from the pocket pivot buy point. At point 5 the market made a final low and Cmg was free to do what it wanted to do all along — go higher.
In this case, the action of CMG during the market correction offered numerous clues that helped to distinguish it as a strong name during a market correction, which then took a major leadership role in the ensuing market bottom and new rally phase that began in early September. Within the market context of a sharp correction, CMG displayed strong relative strength that would have helped alert investors identify it as a strong leader once the market correction came to an end. From this point, Cmg ran some 65% higher over the next three months.
IDENTIFY SHORT SELLING OPPORTUNITIES
Nowhere is market context more important than in short-selling operations. In a bull market, most stocks, even the “dogs,” will tend to go higher. Hence, trying to sell stocks short within the market context of a bull rally is not advisable, as it will tend to offer far lower probabilities of success relative to selling stocks short within the proper market context, namely, a bear market. In Figure 5 we see the NASDAQ stacked on top of Potash Saskatchewan (Pot), both of which are in strong uptrends at point 1 in each of the charts. At point 1 on the Nasdaq chart, the market tops, but Pot continues higher. At this point, the only thing investors know for sure is that the market is beginning what could turn out to be a short-term pullback, and often, leading stocks will continue higher even as the market tops or is in the process of topping. In this case, the market corrects from point 1 to point 2 with a leg down and then a reaction rally, but POT maintains its uptrend right into point 2.
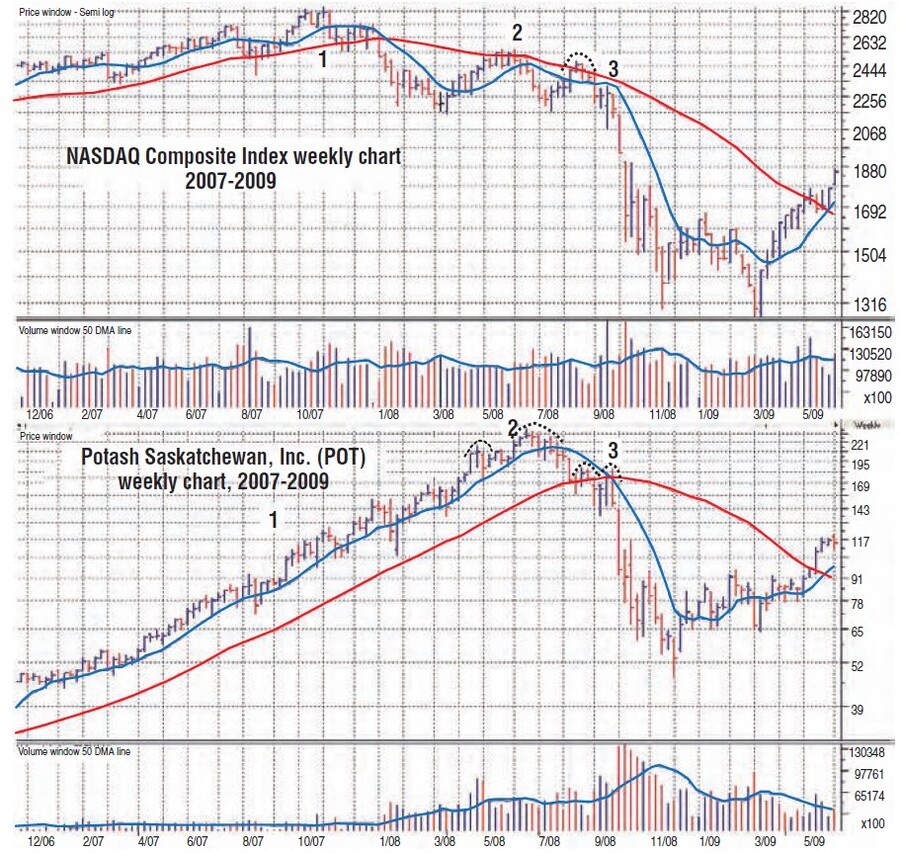
From points 1 to 2, POT is essentially marching to its own tune as it begins to countertrend the market, but from points 2 to 3 it begins to get back into sync with the market. By the time we get to point 3, note that POT has formed a head & shoulders top with one left shoulder, a head at point 2, and two short right shoulders right around point 3. These two right shoulders also mimic the market action at the same point, as we’ve outlined with dotted lines on the NASDAQ chart.
In this case, it only makes sense to short POT once it has formed an identifiable breakdown and topping formation, in this case a head & shoulders. In addition, note that the proper time to short POT is nearly four months from its absolute peak at point 2 and only when it begins to act in synchrony with the market action.
When the market breaks down after point 3 in a major bear market down leg, POT follows right along as it too blows to pieces. In this case, market context was critical in understanding when it was not correct to short a leading stock like POT, and only once POT began to get in sync with the market did it confirm the potential for further weakness by finishing off its head & shoulders formation with two right shoulders that led to the final break that occurred in synchrony with the market.
CHARTS AS VISUAL CHECKPOINTS
Investors can make use of stock charts in many ways, from the highly complex to the extremely simple. Often, valuable information can be gleaned by understanding how to use charts without having to understand statistics or mathematical formulas. Often, charts are most useful when implemented as visual checkpoints, as we have done here.
- Gil Morales is the managing director and chief portfolio manager for MoKa Investors and the cofounder of VirtueOfSelfishInvesting.com; coauthor of GilmoReport.com; and formerly a senior proprietary portfolio manager for William O’Neil + Co. He is also the coauthor of the book Trade Like An O’Neil Disciple: How We Made 18,000% In The Stock Market.
- Chris Kacher is the managing director and chief investment strategist of MoKa Investors, and the cofounder of VirtueOfSelfishInvesting.com. He is a former research analyst and senior proprietary internal portfolio manager for William O’Neil + Co. and coauthored Trade Like An O’Neil Disciple: How We Made 18,000% In The Stock Market.