Trading Articles
Candlestick Pattern Performance: Thomas Bulkowski’s Statistical Findings
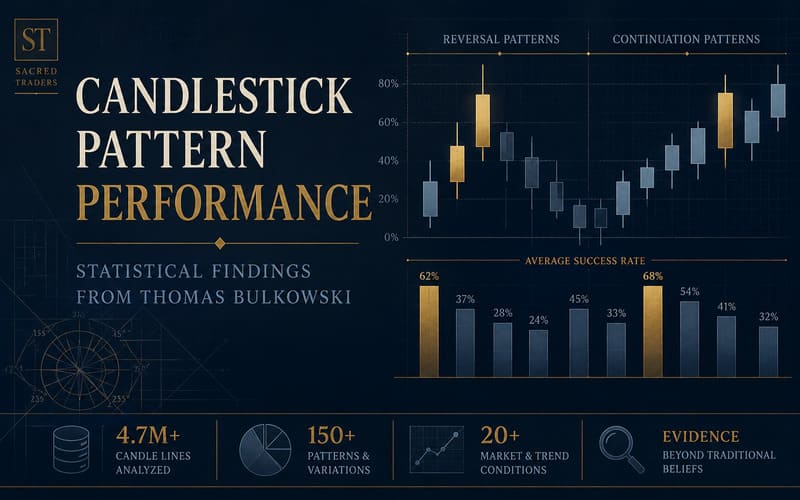
In writing my latest book, Encyclopedia Of Candlestick Charts, I made some startling discoveries. I used more than 4.7 million candle lines (price bars) for the research with data going back as far as the 1980s in hundreds of stocks, but not all stocks covered the entire period.
REVERSALS WIN
One famous technical analyst wrote that continuations perform better than reversals. That would make sense, since it is easier for price to swim with the tide than against it. There is just one problem: That’s wrong. I tested this on thousands of chart patterns and candlesticks with similar results for each. Reversal candlestick patterns outperform continuations 59% to 41% of the time. One explanation is that the price trend in a candlestick continuation is tired and doesn’t move far. After a reversal, however, traders are excited and power the stock in the new direction, leading to an extended move. Those caught on the wrong side of the trade exit their positions and then jump on the new trend, powering it even more. I don’t know if that explanation is correct, but I do know that reversals beat continuations.
TRADE WITH THE TREND
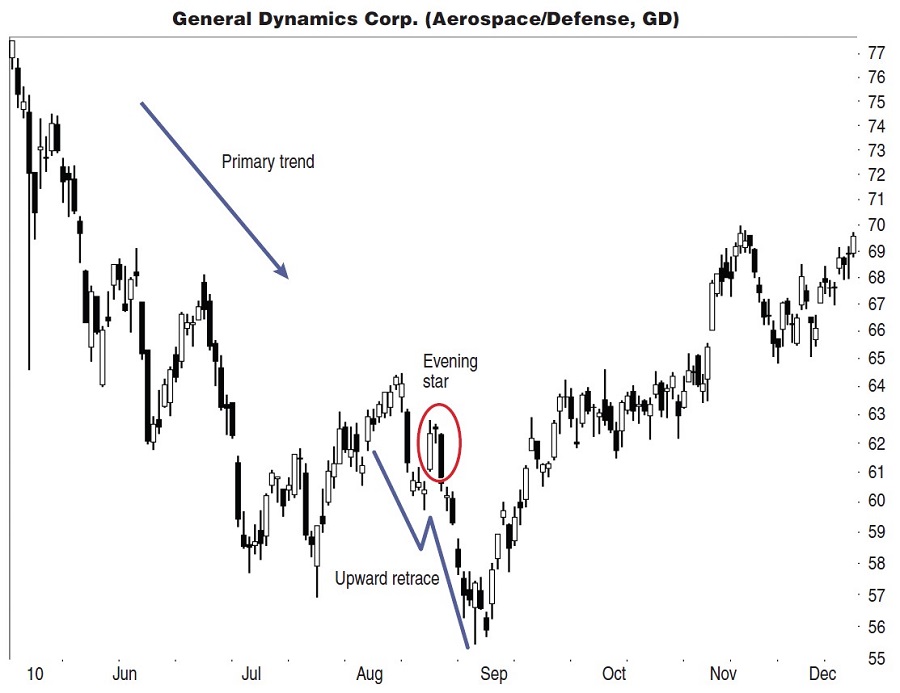
If you’re a serious candlestick player, then you’ll want to know when candles work best. Since we know that reversals work better than continuations, make sure that the breakout direction agrees with the primary trend. For example, a bullish harami requires that the price trend downward into the candlestick pattern. Let’s assume that you’re expecting an upward breakout. If the primary trend is upward and the harami appears in a downward retrace, you’re set. The upward breakout will join with the existing price trend and the current will carry the stock upward. The same is true for downward breakouts. An evening star requires an upward price trend, but the candle acts as a bearish reversal 72% of the time. If the primary trend is down and the evening star appears in an upward retrace of the existing downward move, then a downward breakout will join the existing price trend and away she goes!
Figure 1 shows an example. The primary trend is down-ward over several months leading to the evening star and in the week before the candle appears. The price gaps higher and forms the evening star, followed by a resumption of the decline. When the price closes below the bottom of the candle pattern, it joins with the downward primary trend, leading to a resumption of the decline. As confusing as it sounds, this is an example of an upward retrace in a downward price trend. Look for this type of setup when you want to short a stock or buy at a lower price. Always trade with the trend.
CANDLE CLOSE VERSUS PERFORMANCE
- The best-performing candle patterns had closing prices within a third of the price bar’s low, followed by the middle and high, respectively.
Using the last candle line in a pattern, I split the price bar into thirds and determined where the price closed. Candle patterns such as gravestone doji, three black crows, and takuri lines that define the close at or near the end of the stick were not included. For each candle type, I measured the performance from the to the swing high or low breakout (a close . above or below the candle pattern) to the swing high or low.
For example, a bearish engulfing candle averaged an 11.7% decline in a bear market after a downward breakout when the last price bar’s close was within a third of the low. That compares to the performance associated with the middle third (9.4%) and the highest third (10.2%). Upward breakouts in a bull market showed that the lowest third came in first (2.8% gain), followed by the middle and high thirds at 2.75% and 2.5%, respectively.
Advanced Books and Courses on Candlestick Patterns
BEAR CANDLES RULE!
- Candlestick patterns in a bear market outperform, regardless of the breakout direction.
I sorted the candlestick patterns into bull and bear markets, up and down breakouts, and was surprised to discover that candles in a bear market outperformed those in a bull market. For example, a bullish harami shows a drop of 10.4% after a downward breakout in a bear market compared to a drop of 5.7% in a bull market. That drop is expected since the breakout direction agrees with a bearish market. Performance is better because it follows the existing current.
However, price rises 9.7% in a bear market after an upward breakout compared to a rise of 7.1% in a bull market. Even trading with the prevailing trend doesn’t help in this example. In 96% of the candle pattern types I looked at, performance in a bear market beat that in a bull market.
CANDLE VOLUME: YAWN!
- Most candlesticks with heavy breakout day volume outperformed their light-volume siblings.
In two out of three tests, candle volume turned out to be a poor predictor of performance. In the first test, I found that performance after volume trended down throughout the candlestick pattern led to better performance just 52% of the time. That’s about random. If volume in the candle pattern was above average, however, then 58% outperformed their average or below-average counter-parts. That result is a better number, but it’s still near random. The only test that did well was heavy breakout volume. In 91% of the candle types I looked at, those with heavy breakout day volume outperformed their light-volume siblings.
LOOK FOR LONG SHADOWS
- Look for candles with unusually long wicks.
A candle can have both upper and lower shadows (one or none at all), and they appear on the charts as thin lines at either end of a black or white rectangular body. When the upper or lower shadow is unusually tall, the candle tends to outperform. A poll of the various candle types found that it was true 87% (upper shadows) to 88% (lower shadows) of the time, regardless of the breakout direction or market condition (bull or bear). Look for candles with long wicks.
TALL CANDLESTICKS OUTPERFORM
- Select candles that are unusually tall.
Like long shadows, tall candles perform better than do short ones. What does “short” and “tall” mean in this situation? It varies from candle to candle. A pattern called “13 new price lines” will be much taller than the typical doji, so I compared the height to the breakout price for each candle type. I found that tall candlesticks led to better post-breakout moves than did short ones, just like chart patterns.
In fact, a poll of the various types of candlesticks showed that 96% of tall candles outperformed short ones. If there was one characteristic that determined performance for both chart patterns and candlestick patterns, it was height. Select candles that are very tall.
ENTRY SIGNALS
I looked at three types of confirmation signals for candles: closing price, candle color, and opening gap. Closing price confirmation occurs the day after a pattern completes, and it determines the breakout direction and confirms the candle pattern as valid. Candle color confirmation is seeing a white candle appear the day after a bullish candle completes, and a black candle confirms a bearish candle.
Opening gap confirmation occurs when price gaps at the day’s open after a candle pattern completes, setting the breakout direction and confirming the candle. Of the three confirmation signals, the opening gap worked best probably because there was no delay in confirmation. The other two signals needed another day to complete, but opening gap confirmation needed only the opening price to move higher or lower than the prior close. For example, if you expect a bearish reversal tomorrow and price gaps open lower, that confirms the reversal 82% of the time. Candle color works 13%, and closing price confirmation works the remaining 5% of the time.
FEW CANDLES WORK
Years ago, I talked to a girl about candlesticks and told her that since a bearish harami occurred today, price would likely close lower tomorrow. I was wrong. Price moved higher the next day and the day after that. After making several wrong predictions based on the bullish or bearish phrases in the candles’ names or their theoretical behavior, I began to distrust candles. Then I decided to research them.
I looked at 103 candle types and found that 31% of them didn’t work. They were supposed to be bullish, but price closed below the bottom of the candlestick pattern more often than above it, or they were bearish candles that breakes out upward 53% of the time. It functions not as a bearish reversal candle, but as a bullish continuation.
That leaves 69% of candles that work, which is quite good. However, I consider success rates of less than 60% to be random or nearly so. How many of the candlestick patterns work at least 60% of the time? Of the 103 candle patterns, there are 412 combinations of up and down breakouts in bull and bear markets. Of those 412, only 100 or 24% work at least 60% of the time.
If I filter those 100 by removing rare ones, then just 10% qualify. What do I define as rare? To make this determination, I sorted the candles by how often they appeared in a database composed of the Standard & Poor’s 500 stocks over a 10-year period starting in August 1996. I used the frequency of the 51st candle to determine rare or plentiful status. For reference, the 51st candle pattern appeared 1,973 times out of 1.2 million candle lines, so it’s not like finding grains of sand at a beach. In other words, it won’t do a candle trader any good if the best-performing candle (three stars in the south) occurs only nine times in 4.7 million candle lines. If you see it once, then frame it because you may not see it again in your lifetime.
I consider a success rate of 60% as too close to random to be tradable. Let’s raise the bar to 66% — two out of three times the candle should work as expected. If we were to keep the frequency rank the same, then only 6% would qualify. By these measures, it means that 94% of candle patterns either can’t be found or can’t be trusted.
DO CANDLES WORK IN GROUPS?
If you listen to some candle analysts, they will tell you that you can’t test candles in isolation the way I did; they only work in groups. In that case, think of a hypothetical situation where a blind man is dropped into a house in a city where he’s never been and instructed to find the nearest grocery store without any help. He won’t be able to find the store three miles away. He represents my failed candle.
According to the candle analysts, if I were to add more blind people to the house, thus forming a group, and then tell them to find the nearest grocery store without any outside help, they will magically succeed! I’ll let you form your own conclusions about how often that scenario would work. In the meantime, I’ll stick to the 6% of candles that I consider to be investment grade. What are they? I’ll leave that for my next article.
- Thomas Bulkowski is a private investor with 30 years of experience and is considered to be a leading expert on chart patterns. He is the author of several books, the most recent of which is Encyclopedia Of Candlestick Charts. His free website and blog have more than 500 articles dedicated to price pattern research and can be found at www.thepatternsite.com.