Trading Articles
Squaring Price with Time Through Tempo and Angle Symmetry
Everything in our universe has measurements. We wear shoes of different sizes, different size clothes, different size cars, we have two and four door cars, different horse power motors. Our house is at 44 SO SO street, the house has four bedrooms, three baths, two stories and a two car garage. We measure our height and weight, we count our money and so on… What can you think of that is not a measurement in size, value or price? Of course we all know this, right? We as traders are interested in prices, everything we trade is by price.
The Problem
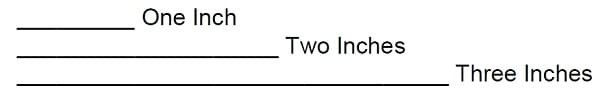
The problem is we have an outdated method of charting prices. You can’t be satisfied with a record keeping charting affair if there are better ways that can identify market movements that produce trend disclosures. Charting values of different sizes and charting them equally is the problem, I find it impossible to think this is logical and final. For example: Let’s suppose a man or woman walks one mile in 5 minutes, then he walks two miles in 10 minutes and he walks three miles in 15 minutes. How would you chart this adventure? Here is one way… One inch equals one mile. Two inches equals two miles. Three inches equals three miles. See figure 1.
Good layout, but it is not in a charted form, so let’s do this, give each mile a proportional square, aside the runs in a vertical manner. See Figure 2.
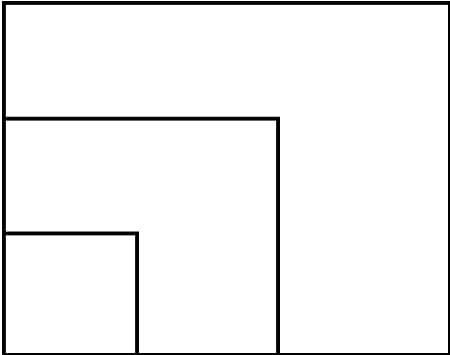
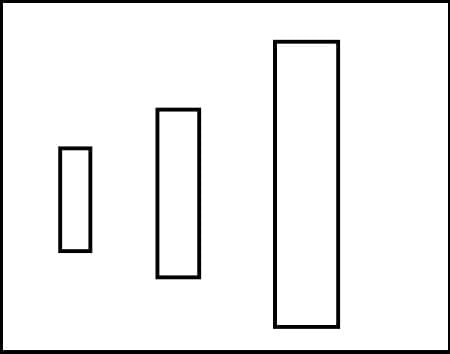
Give the one mile walk a one inch block along side the walk. Give the two mile walk a two inch block along the two mile walk and give the three mile walk a three inch block along the three mile walk. See Figure 3. This is a better charted form, we are now showing the measurement of the walk with the value of time. Great… we are so close to a better charting method. Let us put the amplitude (the measured walk) and the time of the walk together such as this.
Does this seem more logical? This is a lot better block charted form, we are showing the measurement of the walk with the value of time, good. We are so close to a great charting method.
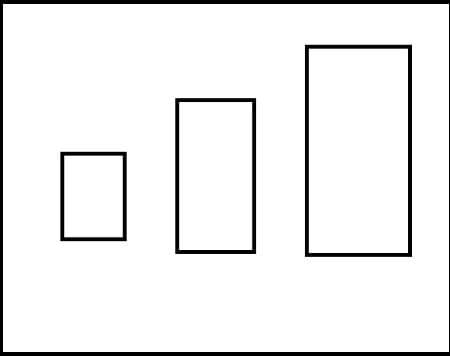
Now lets put the amplitude (the measurement walk) and the time of the walk together as follows: Let’s post the walk (movement) as a vertical bar and for each 5 minutes let’s give the vertical one block in width. Let’s post the walk (movement) as a vertical bar and for each 5 minutes let’s give the vertical one block in width, each 10 minutes will get two blocks in width, and the 15 minutes will get a width of 3 blocks of width. The width is attached to the vertical bar as shown in Figure 4.
The Square of Price with Time
As presented with the man and time experiment, it can be worked with the posting of traded prices. The posted price of any period can be posted in intervals of 15 minutes, 30 minutes, 60 minutes or daily periods. If you add width/space/time to the total price movement making a rectangle with each posted period, see below. See Figure 4. In this demonstration, let’s use one block in width for each 5 cent move, 5 cents move gets one block, 10 cent move will get two blocks, 15 cent move gets three blocks etc. Now you have a value of space/area/time added to it. If the value of time is in true proportion, in all the postings, of the charted prices, this is the first step in the process of squaring price with time. Because each movement is squared with time value, a true trend line could be drawn that has value in trend following. The logic being, why would you draw a trend line from unequal values? Note: This is based on my Angle Symmetrics Trading Method, but do not use the above width as shown, this is not the true Symmetrics Formula.
Advanced Books and Courses on Technical Analysis


The second charting discovery that has become great in the square of price with time is a simple charting method I called Presto 5/4 Angle Trader. This is a simple theory to understand although it took many years to complete. Getting the correct angle to draw was the hardest to match to the correct area for posting the four prices for each period. Presto has four movements to any price move. You have the opening, the high, the low and the close. We all know that much, don’t we? The big trick is to put these four movements of each period so that they will use up the correct space to correctly give validity to the squaring process. Let’s say the price opens at 450, rallies to 460, drops down to 440 and closes at 450. What does that look like on regular bar chart? When I was a broker at Stotler in Dallas, a client called the broker next to me and asked what the beans did today. He answered, “they did nothing” meaning they closed at the same price as yesterday. They went from 450 to 460…10 cents down to 440…20 cents and closed at 450 again. Is that nothing?
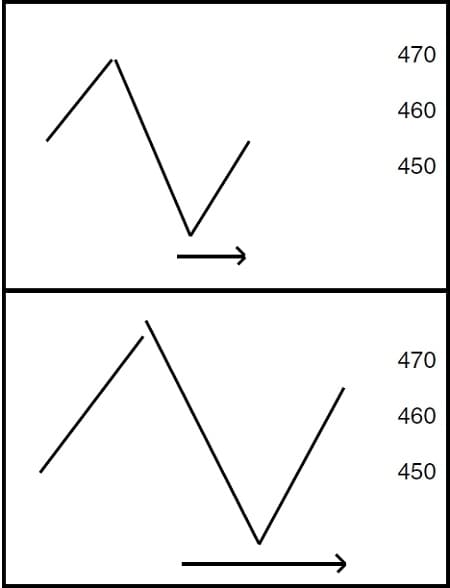
A move of 40 cents is nothing? Now let’s see my Presto charting of the same move below. Warning, the listed charted angles are not Presto angles, they are for movement demonstration only. See Figure 5.
Now you see how the width/time is of value. If the price rallied to 470, 10 cents higher than the 460 high, this would give your angle a 10 cents move upward and also a 10 cents downward. This is a disclosure of new methods that are being used by my students. I must tell you that the Symmetrics Trading Methods are not anything like the volume trading method. I will tell you the difference in a few words; If you have a limit day in beans, with only one contract traded, volume posting would be only a dot on the next line on your chart. With Angle Symmetrics, it would be a limit posting with the closing price posted six or more blocks wide, because the price movement of 30 cents calls for a width of many blocks wide.
The Law of the Triangle
In closing, I want to mention that much of my work has been according to the law of the Triangle. Nothing can exist without three points. This is why we have the high, the close and the width to all my charting. Remember in music, no chord, in any key, can exist without three separate notes.