Trading Articles
The Rsi and Price Trends By Kevin Luo

The relative strength index (RSI) is well known among technical analysts. As with all indicators, it tends to work better on some stocks or at certain times. Can it be modified to give better results? We’ll find out. The relative strength index (RSI) is a popular technical indicator designed to measure the rate of change in price movements. All RSI values fall between zero and 100. One of the common interpretations of RSI is that the stock is oversold when the RSI falls below 30 and overbought when the RSI rises above 70. The initial impression of its application is that you buy when the stock is oversold and sell when the stock is overbought, or go short when the stock is overbought and cover when it is oversold.
How Well Does It Work?
To find out how well it works, I conducted a large-scale backtest on 1,816 random stocks traded on the NYSE and NASDAQ. The test data covered a 10-year period from January 1, 2005 to August 31, 2014. Given the scale of the backtest, the output is considered sufficient, precise, and reliable enough to achieve significant conclusions about the application of the RSI strategy. I applied a custom-built automated system—I’ll refer to it as the software—to run the performance tests.
The backtesting rules are simple. A buy occurs when the RSI value falls below 30. The sell takes place when RSI surges above 70 for the first time after the buy. For testing purposes, the entry and exit prices are the closing prices of the RSI signal days.
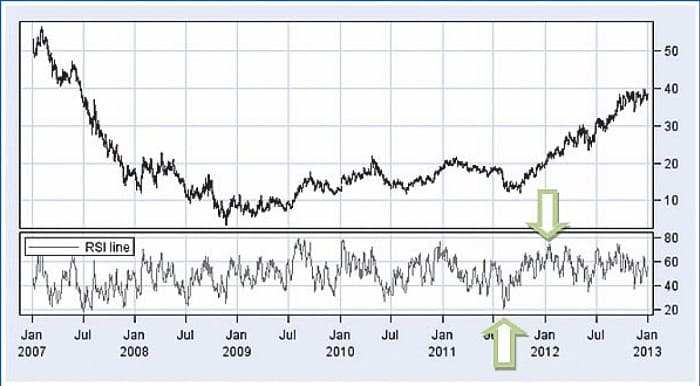
In Figure 1 I’ve shown an example of a trade on a chart of Lennar Corp. (LEN). The green up arrow points to a falling RSI value at 28.03 on August 22, 2011. A long trade was entered at $12.71, which was the closing price of that trading day. On January 11, 2012 the RSI moved up to 72.49 (green down arrow), which is above the selling level. The stock was sold at $22.25, the closing price of that day.
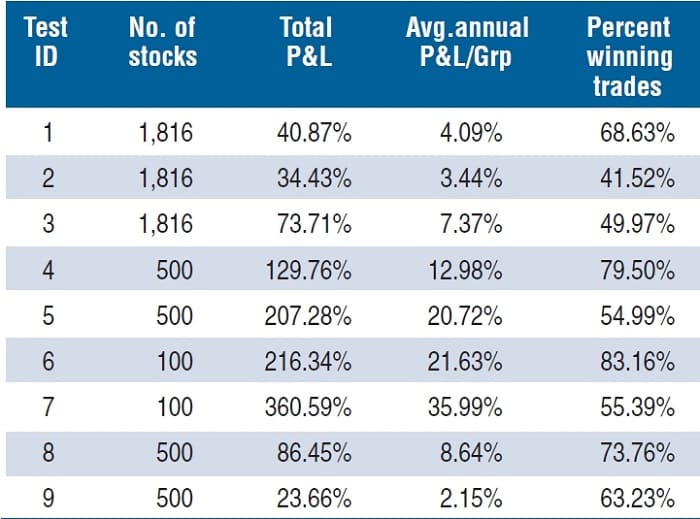
During the backtesting, the software generated long trades for each of the 1,816 stocks and then summarized the test outputs. The profit & loss column in the table in Figure 2 shows that the strategy produced a 4.09% average annual profit & loss (P&L) for the 1,816 stocks in the portfolio (row 1). The performance number was calculated based on an equal-weighted approach. The same weight was assigned to each of the trades regardless of the price of the stock.
There is a negative relationship between the duration of the trend and the performance of the RSI strategy. The strategy is likely to work better on shorter stock trends.
It’s Profitable, But Can It Be Improved
The test results suggest that the trading strategy is profitable. However, the average annual P&L results aren’t strong enough to convince me to trade this strategy. There could be a few reasons behind this. One of them has to do with the foundation of the RSI. The formula used to calculate RSI is:
RSI = 100 – 100 / (1 + RS)
RS = Average gain / Average loss
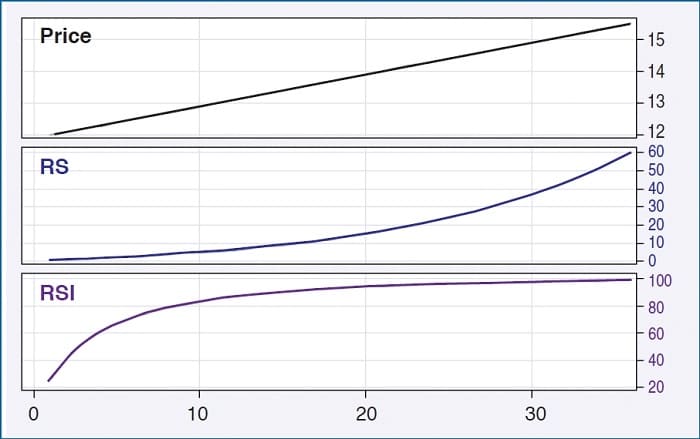
In this formula, the relative strength or RS value represents a ratio between the average gain and average loss. In a perfect and gradual price uptrend (top chart in Figure 3), the RS values accelerate (middle chart) as the price uptrend continues. However, the RSI that was derived from RS rises initially and then slows down significantly after it reaches approximately 70 (bottom chart). This is because, mathematically, the equation to calculate RSI restricts its values to move within its range limits of zero to 100.
This phenomenon also exists in a downtrend. When stocks run into prolonged trends, it tends to become problematic. Going back to the chart of LEN in Figure 1, you see that the RSI values have fallen below 30 over 10 times in 2007 during the course of its steady downtrend. Each time the stock bounced back slightly, RSI values overreacted by jumping up. When price moved back to its downward trend, the RSI followed and triggered oversold signals several times. In the worst-case scenario, if a long trade had gone through on March 2, 2007, which is the first instance of the RSI falling below 30 on the chart, you would have been left with a big loss if you had followed the strategy.
Suggested Books and Courses About Market Indicators


But It Can Get Better
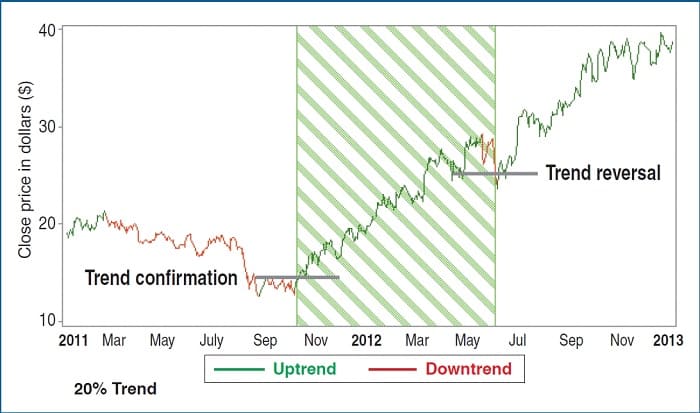
One way to address this issue is to reduce the number of trades during a downtrend. Another approach is to select stocks that move in shorter trends. I conducted a second backtest, which I’ll refer to as test 2, to validate the first approach. In test 2, I applied a trend-trading technique that only traded stocks during uptrends. No trades were opened during downtrends. A downtrend is recognized when prices move down by more than 20% and an uptrend is recognized when prices move up more than 20%. Some of you may recognize this from Dow Theory—appreciation or depreciation in value of more than 20%. In Figure 4 you see a chart of LEN, where the green shaded area covers an uptrend. This uptrend started when the stock advanced 20% (the horizontal bar identifies the uptrend confirmation) from the low of the prior downtrend. The uptrend came to an end when the stock fell 20% from the trend high (the horizontal bar identifies the trend reversal). The idea is to only allow trades to take place within the shaded zone.
In test 2, trades were not held when there was no uptrend. Once the uptrend reversed, all positions were liquidated at the closing price of the day for testing purposes. The other trading rules remained the same. Once the stock trends were isolated, trading rules went into effect only during the uptrends.
The results for test 2 indicate that the strategy underperformed in this test by producing annual returns of only 3.44% (row 2 in Figure 2). According to the summary statistics, there was a significant reduction in trades. The reduction was a result of low oversold signals (or buy signals) during uptrends. Such a reduction in the number of trades obviously leads to missed opportunities. From Figure 1, notice how during the uptrend in 2012 the RSI fell to around 50. If RSI behaves in such a way during most uptrends, raising the RSI entry signal level to 50 would increase the number of trades. So in test 3, I changed the RSI signal level from 30 to 50. All other testing conditions remained the same. As expected, the test return improved from 4.09% to 7.37% (row 3 in Figure 2). For evaluation purposes, I included the top 500 and top 100 performers from test 1 and test 3. The top 500 performers in test 1 generated 12.98% (row 4) while the top 500 performers in test 3 produced 20.72% (row 5) return annually. The top 100 performers in test 1 generated 21.63% (row 6) while the top 100 performers in test 3 produced 35.99% (row 7) return annually.
With three sets of comparable return figures, you can easily evaluate the performance improvement in test 3. The percent winning trades in test 3 were lower than that in test 1. This was the result of the liquidations of trades at trend reversals, which were mostly small losses.
The second approach that is expected to improve performance is to select stocks that typically produce shorter trends. To test this, I selected the top 500 stocks of the 1,816 stocks from a sorted trend size list. The software pulled out the individual test 1 performance of these stocks and summarized the results. These are displayed in row 8 of Figure 2. The annual return was 8.64%. For comparison, the software also selected the bottom 500 stocks, or those that had the larger trends. The return was 2.15% (row 9 of Figure 2). This confirms a negative relationship between the duration of the trend and the performance of the RSI strategy. In other words, the strategy is likely to work better on shorter stock trends.
Get Creative
The RSI is an indicator that can be made into an effective trading strategy. No trading strategy works on all stocks equally well or all the time. Likewise with the RSI, it works better on some stocks with certain characteristics. You have seen how trading during uptrends and trading stocks with shorter trends improve the performance of the RSI strategy. There are also other ways to tweak the RSI to improve its performance. I encourage you to try different methods.
Kevin Luo is an independent technical analysis researcher who focuses on automated price trend–related analysis and generation of trading strategies. He and his project partners developed an automated trend analysis and backtesting system for high- and low-frequency trading. He may be reached via email at [email protected].