Trading Articles
Gann Square of Nine and Elliott Wave Timing in the S&P 500
What do Gann’s square of nine and the Elliott wave theory tell us about the S&P 500 index? We’ll explore. Are the world’s indexes about to turn south for the fourth time since the 2007–2011 global financial crisis (GFC) and Eurozone slumps? W.D. Gann’s square of nine and R.N. Elliott’s wave theory may help shed light on what the future holds. Gann taught us that the behavior of the market is subject to the time factor and the law of vibration, while Elliott postulated that money markets unfold in a fixed eight-wave pattern. Bull markets advance in three motive waves, each followed by a downward correction. Bear markets decline in a zigzag A-B-C pattern, in which waves A and C are motive and the B wave between them corrects upward.
In this article I’ll focus on the S&P 500 index’s B wave—the wildcard of the 2007–2015 bear market rally that penetrated the October 31, 2007 peak of primary wave [V]. The amalgamation of Gann and Elliott into one school of thought highlights the geometric mapping of each of the eight waves of the Elliott wave cycle onto the Gann square at 180º or 360º angles. Given that markets move only up or down, only two angles determine the trend.
Gann’s Elusive “Time Factor”
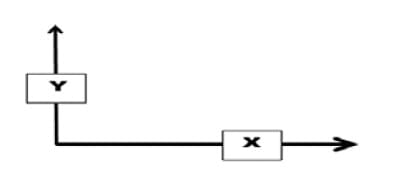
Gauging changes in time and price on a graph means tracking the X and Y coordinates, where X represents time and Y, theebb & flow of price. A continuous plot of X and Y intersection points reflects changes in price over time. Given that X is a function of Y, and Y is a function of X, and given that Y is the more volatile of the two and prone to manipulation, the forward procession of X takes priority over Y (Figure 1).
The principle of change over time was Gann’s signature and the secret he guarded most. Rather than factoring price, he factored time, focusing on the number of hours, days, weeks, or months that lapsed between major peaks and troughs. Price variations were secondary. So too did Elliott. In Nature’s Law, he stated that wave intensity or impulses bear a consistent relation to one another and to the passage of time. The graphs and sketches in the book link major peaks and troughs to time. The 1857–1929 Axe-Houghton-Burgess index, for example, shows a time-based wave count, beginning at the 1857 trough of the first US crash through to the peak of 1929.
The World’s First Measuring Instruments
The formation of the 12 houses of the zodiac, originated by the Sumerians and Babylonians, was the world’s first measuring instrument. The zodiac enabled maritime navigation at night, which relied on the stars and planets’ angular estimates for direction and distance. As it tracked the course of the moon and sun in relation to Earth, people were able to determine the angular position of the planets every day of the year. They observed that the moon’s angular position with Earth regulated the strength of the tides; a full moon aligns at a 180º angle with the sun, a new moon forms a 360º angle with the sun, and when only its first or last quarter is visible, the moon is at a 90º angle with the Earth. Still, as important as the zodiac was to everyday life, it failed to resolve the menace of Babylon’s Tigris and Euphrates Rivers’ annual floods. Year in and year out, thawing snows and rains kept Babylon submerged for months as its clay soil was unable to drain the inflow.
A device embedded with a calendar and protractor that would project future dates corresponding to important planetary angulations was what the Babylonians needed. Ultimately, the list of zodiac positions became a precursor to the world’s second measuring instrument—an orderly numbered spiral capable of projecting the angular position of flood stages by mapping the ebb & flow intervals.
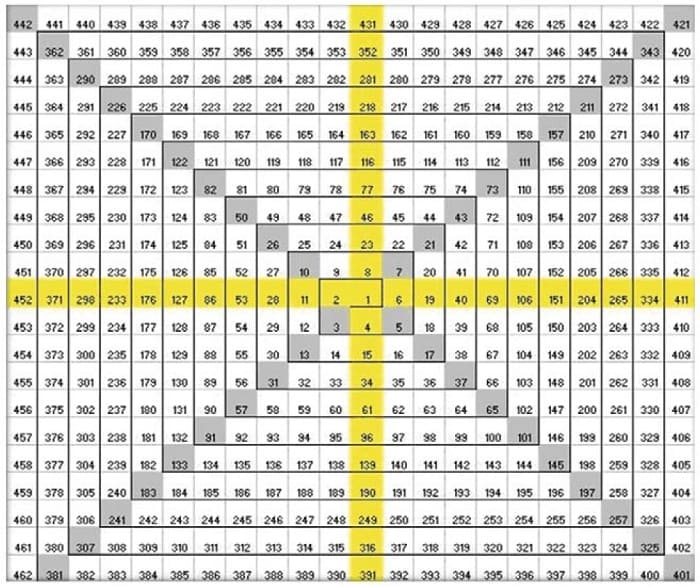
In the distant past, the number 1 at the square’s epicenter symbolized divinity. In flood-ravaged Babylon, it was associated with the thunder and storm deity Marduk, whereas in Egypt, where devastating famines were as frequent as the deadly floods in Babylon, the number 1 was assigned to the sungod Ra. It is said that Gann called the spiral the square of nine (Figure 2) because the first ring contains all the numbers from one to nine. However, given that the sum of its major angles amounts to nine (45º = 4 + 5 = 9; 180º = 1+ 8 + 0 = 9; 270º = 2 + 7 + 0 = 9; 315º = 3 +1 + 5 = 9; and 360º = 3 + 6 + 0 = 9), it is more likely that the name was inspired by angles.
The world’s third measuring instrument was the Nileometer. Rocks or fixed columns carved with horizontal lines scattered along rivers banks measured the height the water had reached every day during the inundation. The longest uninterrupted record collection we have today comes from Nileometers. The Egyptians kept such good flood records that scientists still use their data to better understand rainfall patterns and the El Niño and La Niña phenomena. The Nile records were crucial to Gann’s findings.
At the time he formulated the square, no market contained more than 15 years of data given that Charles Dow’s first Dow Jones Industrial Average (DJIA) records appeared in 1884. The modern-day version of the Nileometer is the world’s stock exchanges, where year in and year out, massive volumes of data are churned 24 hours a day, six days a week.
Square of Nine and The Law of Vibration
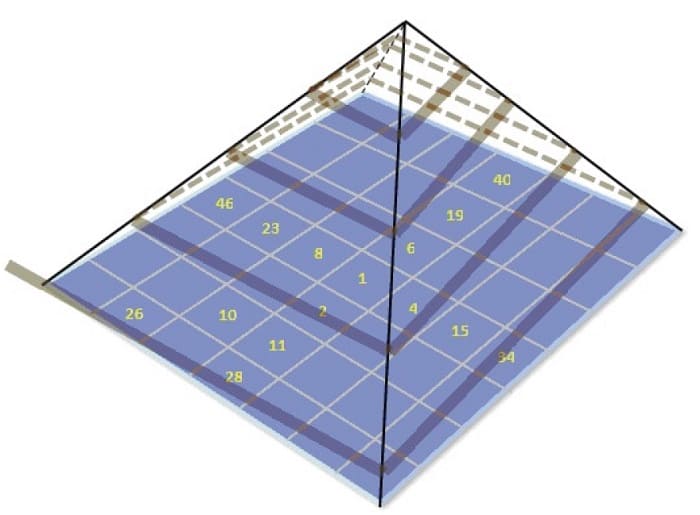
The square’s most important feature is that when pulled from the center, it morphs into a pyramid (Figure 3). This square is a linear representation of a three-dimensional pyramid, and its spiral is a miniature replica mimicking the shape and the right to left spin of the Milky Way. The Babylonians celebrated the square by erecting ziggurats with tiers laid out in a spiral, and no sooner than this knowledge had reached Egypt the pyramids appeared.
Advanced Books and Courses on W.D. Gann Methods


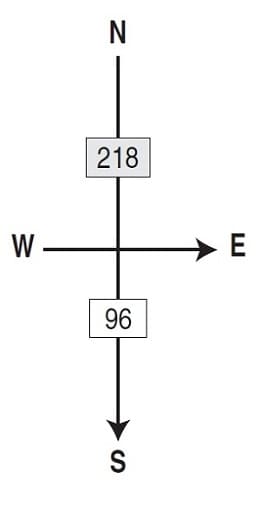
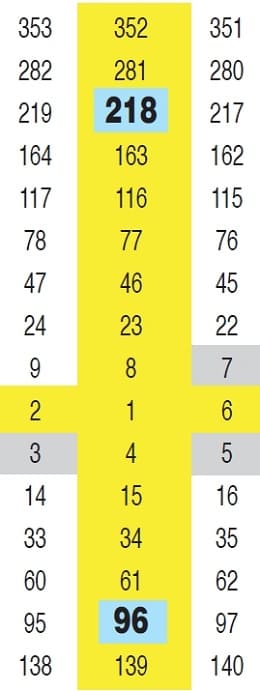
The time factor and the law of vibration are based on two adjacent intervals, one going up and one coming down, that map onto the square at 360° or 180° angles. Gann observed that the ups & downs of markets follow the rhythm of river ebb & flow. When a river flows for 218 days (north cardinal), and then ebbs for 96 days (south cardinal), the up & down stages align at a 180º angle upon the square’s north and south cardinals (Figures 4 & 5).
Biblical Joseph’s prediction of a seven-year period of plenty followed by another seven-year period of famine is the first known allusion to a 360º alignment. This metaphoric 14-year plenty/famine cycle comprised of two seven-year intervals, each bouncing off and terminating at the number seven on the square’s north–east diagonal.
The time factor and law of vibration ensure that the four interval pairs of the Elliott wave cycle relate to one another geometrically by mapping onto the square at 360º or 180º angles. Irrespective of scale order, Waves V and A; A and C; and C and I at the extremities of the Elliott wave cycle terminate at a 360º angle—a coaxial alignment on one of the square’s axes. The cycle’s internal pairs I and II; II and III; III and IV; IV and V; A and B; and B and C terminate at a 180º angle on the square’s two opposing axes. Any other angulation indicates an incomplete interval pair.
Long & Short Time Swings in Markets
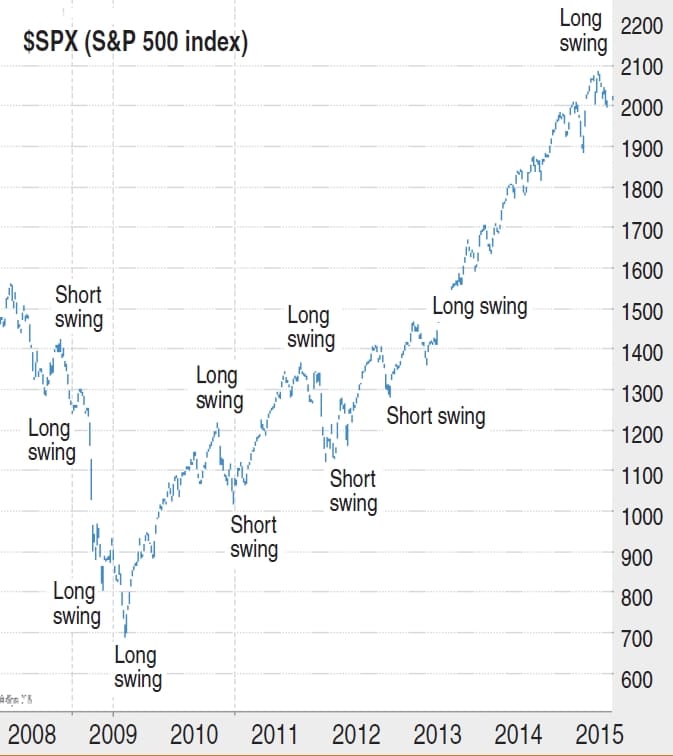
Swings manifesting long advances followed by short declines, irrespective of scale order, are characteristic of bull markets, whereas swings manifesting long declines followed by short advances characterize bear markets (Figure 6). A day, hour, or often a minute may separate a bull market from a bear one (and vice versa)—a fine-tuning process made evident at major peaks and troughs.
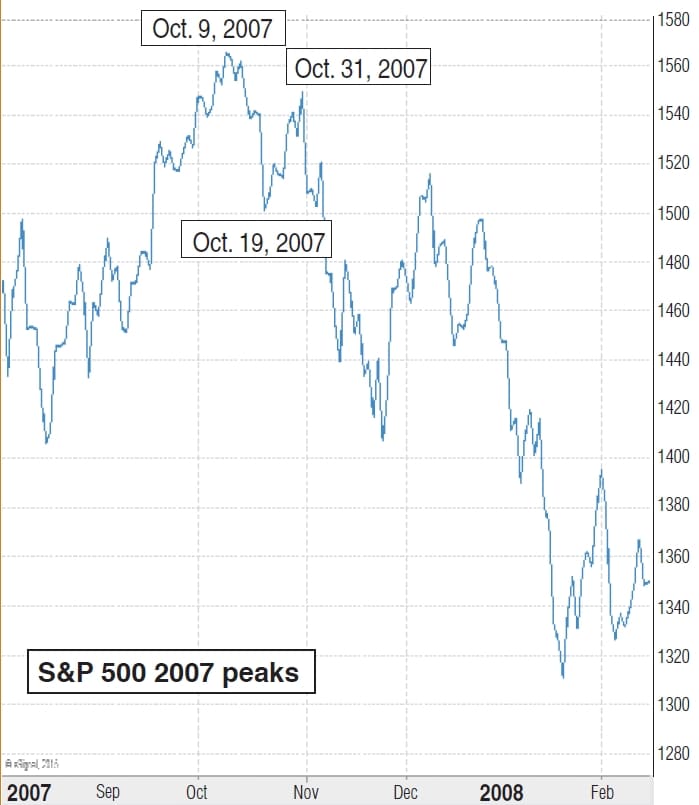
The S&P 500’s two peaks of October 9 and October 31, 2007 are a good example of determining the market’s true peak. The October 9–19, 2007 decline spanned 10 calendar days (cd), and the October 19–31, 2007 advance spanned 12 (Figure 7). Because the 12cd rally from October 19–31 was 2cd longer, this swing marked the index’s true peak even though price-wise, October 31, 2007 closed lower.
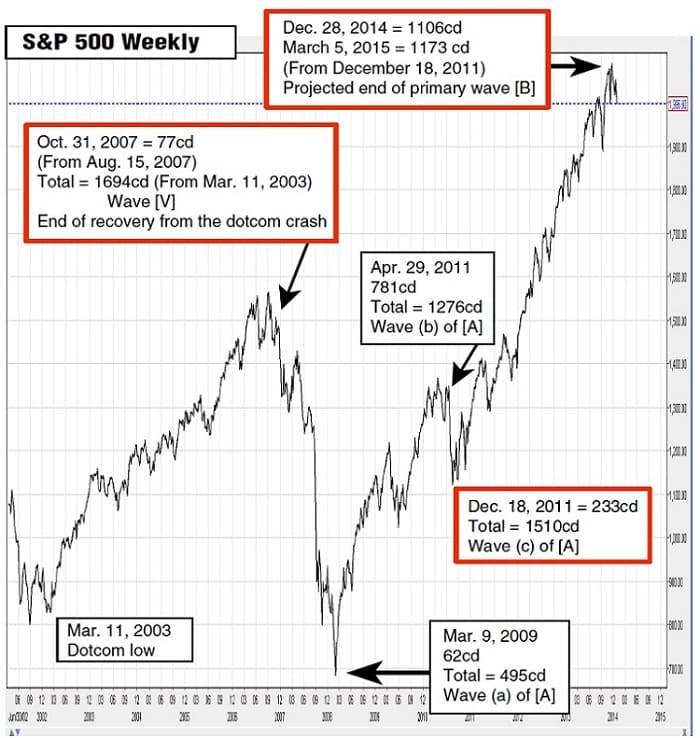
In Figure 8 you see the S&P 500’s weekly chart outlining its wave count. Based on daily records, it captures the final bull market swing of primary wave [V] 2003–2007, the 2007–2009 GFC and Eurozone slumps that formed primary wave [A], and the advance of primary wave [B] to December 28, 2014 and beyond.
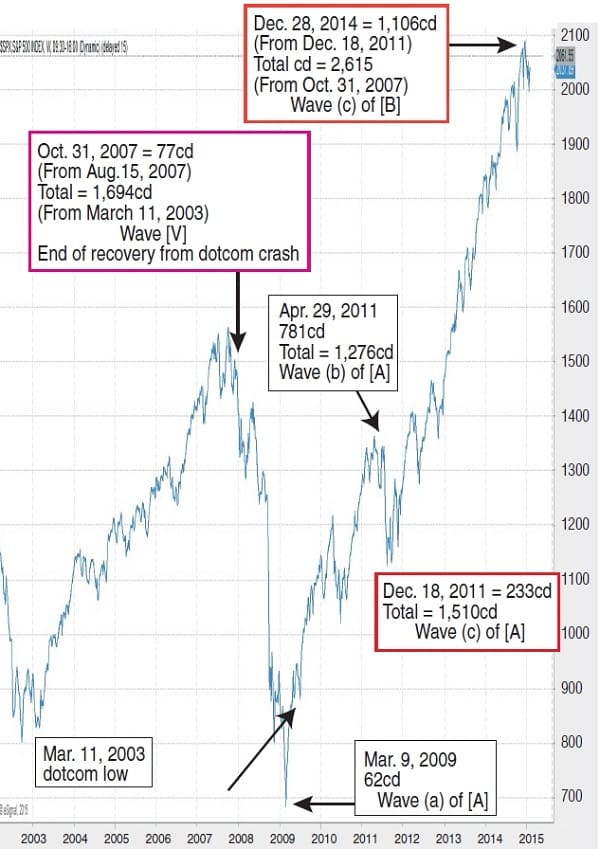
- Primary Wave [V]: March 11, 2003–October 31, 2007 = 1,694cd
- Primary Wave [A]: October 31, 2007–December 18, 2009 = 1,510cd
- Intermediate Wave (a) of [A]: October 31, 2007– March 9, 2007 = 496cd
- Intermediate Wave (b) of [A]: March 9, 2007–April 29, 2011 = 781cd
- Intermediate Wave (c) of [A]: March 9, 2007– December 18, 2011 = 233cd
- Primary Wave [B]: December 18, 2011–December 28, 2014 = 1,106cd (incomplete) (Wave B manifests a shorter span than Waves A or C).
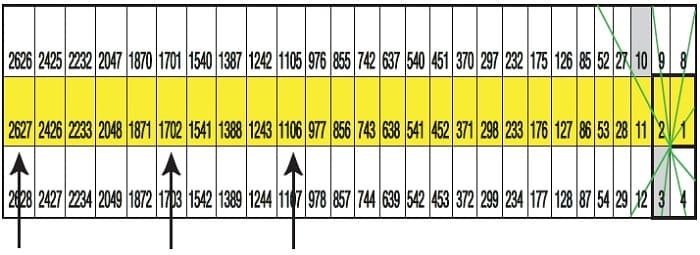
Market intervals are subject to time dilation. Durations measuring several hundred days may require adjustment to the value of the nearest cardinal on the square (Figure 9). While the 1,694 and 2,613cd periods correspond to the square’s west cardinal’s 1,702 and 2,627, the 1,106cd span, also on the west cardinal, required no adjustment. And given that the three bounced off and terminated on the square’s west, they formed 360º angles with one another, while the combined 2,618cd span of primary waves [A] and [B] approximated the Fibonacci ratio of 2.618.
Primary Wave [B]
Given that wave B is an internal swing, it must terminate at a 180º angle with waves V and A. Thus, the 360º angle between October 31, 2007 and December 28, 2014 could not have ended primary wave [B]’s advance. Figures 10, 11, & 12 outline the irregular “a-b-c-d-e” rally of primary wave [B], which, in addition to penetrating the October 31, 2007 bull market peak, advanced in five, rather than three, intermediate swings.
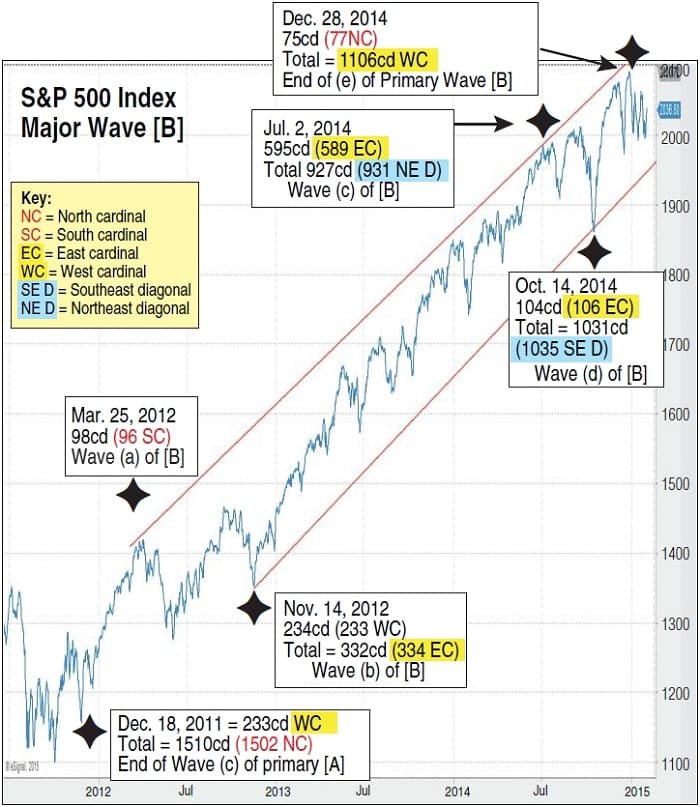
- October 31, 2007–December 18, 2011 primary wave [A] total = 1,510cd (1,502 north cardinal)
- December 18, 2011–March 25, 2012 intermediate wave (c) of primary [A] 98cd (96 south cardinal) = 180º (incomplete advance given that waves a and c terminate at a 360º angle)
- March 25, 2012–November 14, 2012 intermediate waves (a) and (b) of primary [B] 234cd (233 west cardinal). Given that no 180º alignment had formed, November 14, 2014 could not have been an absolute trough.
- November 14, 2012–July 2, 2014 intermediate waves (b) and (c) 595cd (589 east cardinal) = 180º. The perfect 180º angle on the square’s east and west axes between primary waves [V] and [B] on July 2, 2014 appeared as wave [B]’s final peak. It was followed by a sharp 104cd decline during which the S&P 500 recorded a loss of 128 index points. Neither Gann’s square nor Elliott’s wave count could have projected that there would be a turnaround, a penetration of the July 2, 2014 price peak and that wave [B], instead of unfolding in a three-stage A-B-C pattern, would unfold in five. The reversal on October 14, 2014 made primary wave [B] the wildcard of the entire rally.
- July 2, 2014–October 14, 2014 = 104cd (106 east cardinal) = 360º
- October 14, 2014–December 28, 2014 = 75cd (77 north cardinal)
- March 25, 2012–November 14, 2012 wave (c) of [A] = 234cd (233 west cardinal) is the beginning of primary wave [B]
- November 14, 2012–December 28, 2014 = 1,106cd (west cardinal) = 360º with wave (c) of [A], west cardinal, and 360º with primary wave [V] December 28, 2014 could not have been wave [B]’s final peak.
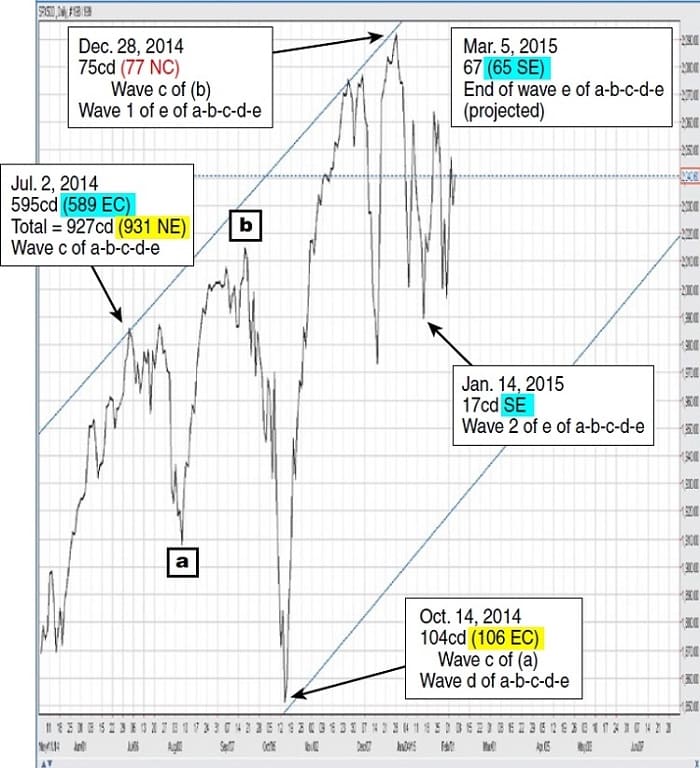
Figure 11 outlines primary wave [B]’s lesser a-b-c pattern, which corresponds to waves c, d, and e of the larger a-b-c-d-e advance. Following the December 28, 2014 peak, wave e of the S&P 500 index unfolded in a five-wave zigzag pattern.
- July 2, 2014–October 14, 2014 = 104cd (106 east cardinal) = 360º
- October 14, 2014–December 28, 2014 = 75cd (77 north cardinal)
- December 28, 2014–January 14, 2015 = 17cd southeast
- January 14, 2015–March 5, 2015 = 67 cd (65 SE)
On March 5, 2015 primary wave [B]’s span will measure 1,173cd and complete the final e-swing of the a-b-c-d-e pattern. It will land upon the square’s east cardinal at a 180º angle with primary wave [V]’s 1,694cd and at 360º with the 17cd span of December 28, 2014–January 14, 2015 swing.
Given that the October 31, 2007 peak terminated on day 1,694 of the run, eight days ahead of the west cardinal’s 1,702, it leaves room for primary wave B to compensate for the shortfall by terminating up to 8cd belatedly.
Mystery Solved
The practice of graphing and analyzing river patterns in Babylon and Egypt, in addition to pioneering the art of charting, had inadvertently solved the mystery of market ups and downs. All that remains for us today are the ziggurats and the pyramids, two mathematical papyri—the Rind and the Moscow—and the 622 to 1970 CE series of Nile inundation records collected from Nileometer readings.
Five and a half thousand years ago, the ancients discovered the matrix onto which nature encoded the time factor and the law of vibration. No periodicity in the universe can bypass these laws. Intervals large and small are embedded in a spiral, which all ancient civilizations enshrined in pyramidal tiers. Time is the foundation of intelligent design and the heart of sacred knowledge. The square of nine holds the key to understanding the cosmic clock—the universe’s fourth dimension that governs every physical aspect of our lives.
Stephen Hawking and Leonard Mlodinov wrote in the The Grand Design that “a model is good if it is elegant, contains few arbitrary or adjustable elements, agrees with or explains existing observations, and makes detailed predictions about the future which can disprove or falsify it if they are not borne out.” As a forecasting tool, the square of nine more than satisfies the criteria. It contains no arbitrary elements, agrees with observations, and makes accurate future forecasts. The square of nine is indeed elegant.
- Pauline Novak-Reich is a former foreign exchange–research manager with a multinational Australian bank. Now an educator and author based in Melbourne, she continues her longstanding passion for using the Elliott wave theory and the square of nine to time the financial markets. Her first book The Bell Does Ring was published in 2005. Her second, Mystifying Square, Divine Proportions—Nature’s Black Box, came out in November 2014. She is currently editing its sequel, The Odyssey Of Sacred Knowledge, and hopes to have it published later this year.