Why Stock Prices Move: Four Core Drivers Explained
In a article titled “Gems Among The Talus,” Thomas Maskell outlined three reasons for stock[...]
Trading Breakouts and Retracements with TMV: Barbara Star’s Method Explained
Making good trading decisions involves finding indicators that cut through the market noise. But how[...]
Intraday vs Overnight Returns: Erik Skyba’s Statistical Study
Anomalies in the markets appear on occasion and challenge the efficient market hypothesis. Here’s a[...]

Succeeding as a Trader: Tom Hamilton’s Structured Development Approach
So you want to become a trader? Don’t miss the critical first step that can[...]
Day Trading Discipline: Six Execution Tips from Alex Wasilewski
Daytrading’s not a profession for the weak, that’s for sure. Try these tips to help[...]

Forex Arbitrage Strategies: An Analytical Review of Joseph James Gelet’s Guide
What should traders understand about arbitrage as it pertains to the forex market? Foreign exchange[...]

Data-Driven Trading Systems: An Analytical Review of Steve Palmquist’s Approach
There are three keys to long-term trading success: knowing what to trade, knowing when to[...]
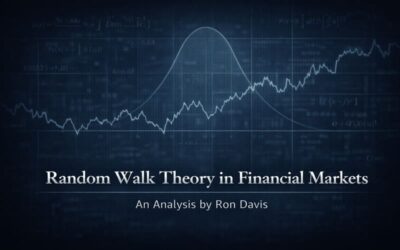
Random Walk Theory in Financial Markets: An Analysis by Ron Davis
Most indicators are correlated to the cyclical movements of the market. Here is an indicator[...]
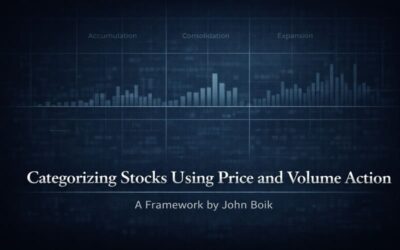
Categorizing Stocks Using Price and Volume Action: A Framework by John Boik
By analyzing certain strengths and weaknesses, you can get a better handle on how stocks[...]
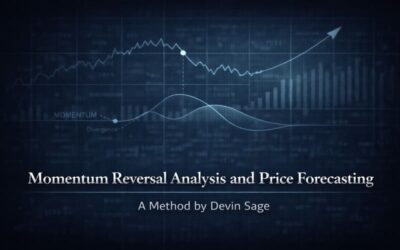
Momentum Reversal Analysis and Price Forecasting: A Method by Devin Sage
Spotting a reversal in the current momentum of the market and forecasting its price movement[...]

The Eight Best Performing Candlestick Patterns By Thomas N. Bulkowski
After removing rare candlesticks and combining reversal or continuation rates with performance after 10 days,[...]
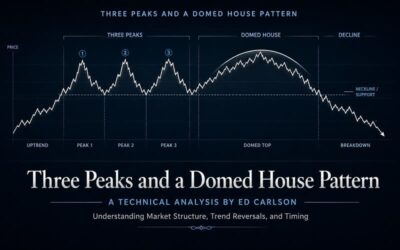
Three Peaks and a Domed House Pattern: A Technical Analysis By Ed Carlson
Predicting and timing the tops of bull markets — both cyclical and secular — can[...]