Trading Articles
Risk Management, Position Sizing, And Probability By Brian Auit
Implement a well-planned strategy before initiating your next trade so you can sustain losses. This methodical approach allows you to consider all the factors before initiating your next trade so you can build that elusive 45-de-gree angled equity curve with your trading capital. Say you’ve booked 16 winning trades in a row. Your account has jumped 12% in value. Your ability to define your edge has never been more focused and your confidence increases with each and every successful outcome. But out of nowhere comes— November 18, 1985, Monday Night Football.
Millions of viewers watched in horror as an event still considered to be the most shocking moment in Nfl history unfolded. Within seconds, an attempted blitz literally snapped quarterback Joe Theismann’s leg, causing a horrific compound fracture and putting a definitive end to his career. This event had the same characteristics that too many traders are all too familiar with, in which a trade we didn’t see coming blindsides us and not only wipes out our profit but cripples our account to the point of “retirement” without a fresh injection of capital. This happens every day in trading and perhaps it has even happened to you. Most of us have experienced something similar at some point in our trading career. So how could we let this happen, and more important, how can we prevent this from ever happening again? You can do this by employing three simple disciplines: risk management, position sizing, and probability.
The Need For Three
As a trader and student of the markets, I have suffered more “blitzes” in my 12-year trading career than I care to discuss, and like so many traders before me, I decided to treat my trading like a business. Once I did that, trading became boring, but boring can be so profitable! Three years ago in March 2006 I decided to get off my personal roller-coaster (otherwise known as my equity curve) and hop aboard the merry-go-round. The ups and downs are minimal and expected, while you are constantly moving in one predictable direction. I created an Excel-based program that I called the m3, an acronym for “Money Management Modeler,” and it has changed the way I approach the markets. It began with a trade I was about to put on, but first, I pulled out pen and paper and answered these questions:
- If I get stopped out, how many points am I willing to lose before I realize that this trade just isn’t going to work out?
- If I do lose, how much money will it cost me?
- In percentage terms, what does that dollar loss represent of my trading capital, and am I comfortable with these numbers (dollar amount lost and the percentage of my trading capital)?
- If the trade is a winner, where do I want to exit or take my profits?
- Do I want to sell all of my position if it is a winner, or do I want to scale out in the event that the trade moves substantially in my favor?
- If I have defined an edge as to why I am initiating the trade, what is the probability of a successful outcome?
I needed a tool that addressed the three disciplines I felt I lacked consistency in: risk management, position sizing, and probability. It has been said that trading is 90% mental and the rest is easy. Let me tell you from personal experience: I couldn’t agree more.
Legging and The Win/Loss Ratio
Rarely do you find risk management software that addresses legging. For those of you unfamiliar with the term, “legging” or “scaling” is the process by which you add to or reduce from an existing position. For example, if I held 600 shares of a winning position, we have the option of scaling or legging out of the trade in hopes of turning a modest gain into a more substantial one. It has been said that most of your profit at the end of the month will come from 15% to 20% of your actual trades. If I were to take 40 trades in a month, I can accept that approximately 30 of those trades will end up being a wash where any small gains will be offset by small losing trades. It’s the eight to 10 remaining trades in which I will make 90% or more of my profits, but I don’t know which eight to 10 out of the 40 will be the ones I am after. Scaling addresses this challenge.
Returning to the 600-share example, assuming the trade is a winner 65 % of the time, using my methodology, I would sell a third of the position for a two- or three-point profit, realizing a gain. The remaining 400 shares are still in play in the event the move continues in my favor. I also would then move my original stop-loss to breakeven in the event the position reverses, thereby preventing any future loss. This is a common practice and a sound methodology used by traders around the world. However, is it truly the best and most profitable option when factoring in probability?
For that matter, how do you define a winning trade? I define a winning trade as a trade that has reached the first profit objective — in this current example, that would be the three points. You can define whatever point objective you feel comfortable with based on your past trading results, but the point is, when that initial point objective has been reached, you have secured a winning trade. How you now choose to exit the trade becomes a matter of personal style. There are many traders who will close down the entire position at their first and only point objective, and a case can definitely be made for that approach. However, that would then eliminate you from the more elusive large wins I mentioned. The all-out approach at your first point objective can and does work, but the trading results must justify it. Legging out of a trade with progressively higher point objectives must also be justified by a thorough examination of your past trading results.
Traders who leg out of the position in an attempt to secure larger profits would also consider reaching the first three-point objective a winning trade. It is an individual choice or methodology should you wish to scale out of the position in the quest for more profit, but the first point objective has been reached regardless of your exit strategy, and that, in anyone’s book, is a winning trade. By removing all risk with the adjustment of my initial hard stop to breakeven (B/E) after the first point objective has been reached, I have just defined my win/loss ratio. Each trader must be aware of his or her individual trading results, with none being more important than your wins to losses. In this example I am assuming that I reach my first point objective 65% of the time, and therefore, my win/loss ratio is 65. In other words, out of 100 trades, I can expect to be wrong 35 times. This is the first of two critical metrics that every trader must be aware of if they are to hope to consistently win.
Suggested Books and Courses About Money Management
Returning again to the 600-share hypothetical trade, let’s now assume the stock is currently trading at $50 a share. My first profit objective is three points, whereas I will sell a third of the position at $53. Based on my own trading results, the first thing I need to know is the probability of reaching that initial three-point profit. Let’s make a further assumption and say there is a 65% probability that, using my methodology, the stock can garner that initial three-point profit. Given that I have chosen to scale out of a winning position — remember we are after the eight to 10 big winning trades — my second profit objective is five points (two additional points) on the second 200 shares of the remaining 400. The probability of success automatically diminishes, and hence larger profits.
Why can’t you just look for a 10- to 20-point profit every time you initiate a trade? The reality is, the more we ask of the markets, the less the probability becomes of reaching those objectives. An additional two-point profit objective in addition to your original three-point objective has a diminished probability of occurrence. Armed with that knowledge, is scaling out of a trade at progressively higher profit objectives superior to the guaranteed profit if you were to sell all 600 shares for the initial three-point profit? The law of diminishing returns immediately comes to mind. Yes, greater profits can be had, but with a reduced probability of ever realizing them.
In Toronto, Canada, there is a popular lottery game called Pro-Line that allows you to wager x on sports games. The sport itself is irrelevant, but the dynamics in the way the game is structured is a perfect example of scaling out of a position in our quest for bigger profits. With Pro-Line, you must play a minimum number of games. The games do not need to be of the same sport. The only criterion is that your picks win. The more games you play, the greater the payout, but the lower the probability of a successful outcome. The minimum number of games you can play on a single ticket is three. If any of the three games that you selected lose, you lose your entire wager. If you were to select seven games in the hopes of a huge payoff, all it takes is one of the seven games to lose and your entire wager is lost even though you correctly predicted the remaining six games. We must always find a balance between greater profit objectives and the diminishing probability of occurrence.
The Lowest Common Denominator
The lowest common denominator (lcd) is a simple but critical calculation every trader must be aware of, and it is the second metric used to determine the sustained viability of your current approach to risk management, position sizing, and probability. Your lcd is calculated by dividing your first point objective by your hard stop. A hard stop closes out the entire position, should the first point objective not be reached.
Continuing with the 600-share example, if my stop were two points, then all 600 shares would be sold (assuming I am long the position) at a price of 48, even though I am willing to scale out the same position in the event of a winning trade. By dividing my three-point winner by my two-point stop, I have established an lcd of 1.50. When you leg out of a winning position, you have to acknowledge the unique characteristics of each profit objective. In a sense you are treating each point objective as a separate trade.
From a pure risk/reward perspective, the actual number of shares or contracts traded has no bearing on your lcd. If I were to increase the position size to 1,000 shares, I still have a three-point profit objective and a two-point hard stop in place, producing the same 1.50 lcd. Now admittedly, a loss of two points on a 1,000-share trade may be too great relative to your trading capital. Your position size is always a component of your risk management.
I have a quick question for you. You are about to initiate a long position on the ES (SP500 e-mini). You plan on scaling out of a winner in two steps and you will use a hard stop of 3.5 points should the trade become a loser. Your first profit target is five points; your second is eight points. However, you acknowledge that while you have a 62% probability of reaching the initial five points, there is only a 39% probability of reaching the additional three points to claim the eight-point objective. Which exit is the superior strategy? In reality, this is a loaded question. First, for those of you who don’t trade the ES (SP500 e-mini), a single point represents a $50 profit (or loss), so a five-point first point objective would pay $250 per contract and eight points would pay a $400 profit for a total of $650. Selling both contracts at the first point objective would give you a $500 total profit, so the obvious winner is with the legging-out approach. But is it really?
Probability
Going back to the Pro-Line example, we know that selecting more games on your ticket increases the payout greatly, but the odds diminish exponentially for each game you add. Remember: one losing game on the ticket negates all the other winners. Reaching your second point objective is not as probable as reaching the first, and therefore those dynamics must be factored in prior to making the decision. This is a loaded question, and here’s why. On an individual trade analysis, we saw that the two-legged exit pays more, but we haven’t factored in probability.
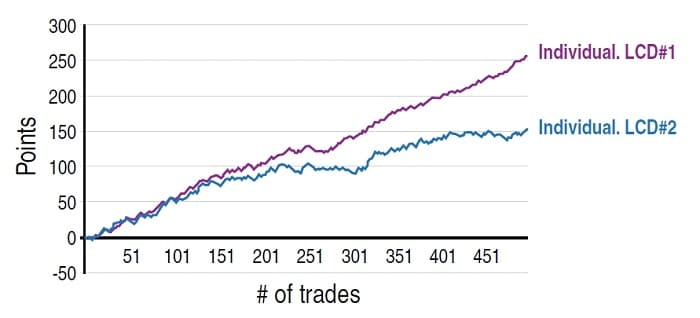
By analyzing 500 hypothetical trades using the two core metrics discussed, those being the win/loss ratio (your probability percentile, which is 62% in the current ES example) and your lcd (1.42, which is derived by dividing your first five-point objective by the 3.5 hard stop), I can see what my potential equity curve looks like over a series of trades. Instead of just a single winning trade analysis, we can now factor in probability (62% first point objective and 39% second point objective). What I am doing is stress-testing the results (two core metrics) using a Monte Carlo simulation.
The percentage of trading wins and losses over a series of trades with predefined point objectives and stops does not change. It is 100% constant (62% success at reaching first point objective and the 1.42 lcd). What does change is the order in which the wins and losses occur so you can determine whether your trading account can withstand hypothetical sustained drawdowns. I designed the m3 platform to specifically address these analytical what-if scenarios. Here are the breakdown results after running multiple random outcomes over a 500-trade sample size as opposed to a single trade analysis. Out of 500 trades we have the following winning trade percentages per leg:
- Leg 1: 62% or 310 of the 500 trades taken
- Leg 2: 39% or 195 of the 500 trades taken
In Figure 1 you see the analysis of the two-legged exit, which appears to be the superior option.
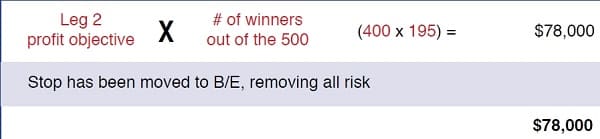
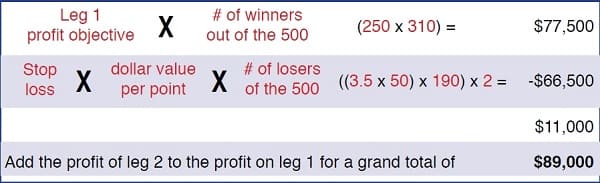
In Figure 2 you see the leg 1 results. If you add the profit of leg 2 to the profit of leg 1, you get a grand total of $89,000.
In Figure 3 you see the results of selling both contracts at the first profit objective. This gives you a grand total of $88,500.
As you can see, if you only have a 39% probability of reaching your second point objective, scaling out of a winning position is superior. The differences are minimal. It is only $500 less were you to have closed your position at your first 5 point objective. Note that in the given example, I adjusted the stop to breakeven after the first point objective was reached. This allowed me to establish a risk-free trade. If the position were to reverse (assuming I am long the position), I would be stopped out with no loss on the second leg.
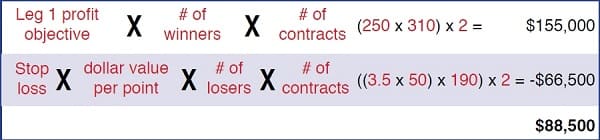
This is not to say that scaling out of a winning trade is inferior to a single exit. In Figure 4 you can see that by leaving your initial hard stop intact with no adjustment after the first point objective has been reached, the single exit outperforms the two-leg exit. This may not be the case if your trading results were different — what if you reached your second profit objective 44% of the time? Those new inputs will greatly alter your optimal exit strategy.
Trading styles and methodologies are as unique as the individual trader. I may choose to move my stop up to a breakeven position after my first point objective has been realized. Another trader may elect to leave the initial stop intact for the second leg or adjust the stop from the initial 3.5 points to a 1.5-point stop. You may prefer a second point objective of six points with a 48% probability of success combined with a lower first point objective of perhaps four points with a 69% probability of profit.
Position Sizing
One of the biggest hurdles that traders face is having to recover from a drawdown. As an old and famous saying puts it: “Tough times don’t build character. They reveal it.” With that in mind, how do you handle a trading setback or drawdown? Many try the quick-fix approach by increasing their position size on the next trade, only to find they have dug an even deeper hole if that next trade is another loser. Define your edge, apply risk and position management techniques, factor in probable outcomes and you will, in time, recover from what was (let’s hope) a disciplined setback. There is no shame in taking a losing trade as long as it was a calculated loss, where you clearly defined your risk prior to initiating.
Have you ever wondered how many trades, going forward, you will need to take to recover those losses with a probable outcome? If I were to take all positions off the table at my first point objective, I may find I need 12 trades to recover, accepting that I can expect to be correct on 62% of those trades. Of course, I have no idea which of the 12 will be the winners, which is why your stops and position sizing are a critical component in the calculation. Each trader has his or her individual risk tolerance, yet what separates the consummate professional from the novice trader is accepting the potential for loss on each and every trade. The best traders prepare for the inevitable losses that will occur. This preparedness is what sustains the 45-degree angled equity curve. The ability to know exactly how many contracts or shares to trade the next time you identify a trading opportunity is invaluable.
Anyone can use a calculator to determine what 1% or 2% or 3% of a $70,000 trading account is. If you are a trader whose methodology includes scaling out of a winning position, have you considered what your returns could be if you were to not only add additional contracts as the account balance grows but analyze the differences in profit by closing out the additional shares/contracts at various point objectives? If a trading account were to begin with $45,000 and eight months later rose to $70,000, you can afford more without any additional risk in percentage terms to your trading capital. If you began by trading the S&P 500 e-mini with five contracts and are now in a position to comfortably trade seven, what is the optimal leg to sell those additional two contracts? Is it your first point objective, the second, or is it the third and most aggressive leg? Perhaps it is a combination of any of those three legs when probability is factored into the equation.
Discipline, Discipline, Discipline
I started out this article by comparing a blindsided blitz in football to the trader who wasn’t prepared: the trader who didn’t define his or her stop-loss, or profit objective; the trader who didn’t factor in the probability of success or analyze the absolute best course of action as to whether legging out was superior to the single profit objective exit. Football is a different environment than trading, but the results can be universal for the unprepared: pain.
With proper discipline in place prior to initiating your next trade, you will be able to sustain a loss or even a string of losses because each trade was a thoroughly planned calculated risk vs. reward decision. When you do this, you accept the risks of trading on your terms. A loss won’t devastate you financially or emotionally, and your quest to recover the eventual loss or drawdown will be methodical and defined. Growth or losses in your trading account will be addressed by dynamically adjusting position sizes on your next trades and eventually, you will begin to see the ever-elusive but much talked about 45-degree angled equity curve we are all after.
Brian Ault is a full-time trader, trading directionally in the equities and futures markets. He is the founder of Fulcrum Shift Trading, which consults with retail and institutional clients, focusing on risk management, position sizing, and probability trading platforms. He is the developer of m3 — the Money Management Modeler, Fulcrum’s flagship product, which is an Excel-based modeling program that addresses the scaling dynamic when directionally trading.